Note: This article will be removed by Winter 2022 as the System Performance Measures (Beta) will be phased out. Please refer to the following System Performance Measure articles for information and guidance on how to use the new SPM fields in Looker.
System Performance Measures - New Articles:
- System Performance Measures - New
- Measure 1: Length of Time Homeless
- Measure 2: Returns to Homelessness
- Measure 3: Number of Homeless Persons
- Measure 4: Employment and Income Growth for Homeless Persons in CoC Program-funded Projects
- Measure 5: Number of Persons who Become Homeless for the First Time
- Measure 7: Successful Placement from Street Outreach and Successful Placement in or Retention of Permanent Housing
- System Performance Measures Dashboard
Using System Performance Measures in Looker
The System Performance Measures (SPM) are meant to provide a high level assessment whether a Continuum of Care (COC) is accomplishing the goals set down by the McKinney-Vento Homeless Assistance Act.
Reviewing HUDs (Housing and Urban Development) System Performance Measures Introductory Guide is advised BEFORE EXPLORING the measures in Looker. The Guide offers an explanation of each of the measures and how to use them in your community.
This article will show how to get the most information out of running the System Performance Measures in Looker. You should have a basic understanding of Looker before using these measures.
The Measures are currently in development. As they are created and tested, new measures will be added to Looker. The calculations are quite complicated and require significant coding to work to HUD specifications. In other words, this is a work in progress.
Running System Performance Measures in Looker
The System Performance Measures dimensions are included in the HMIS Performance Looker model.
Running the SPM in Looker is similar to other dimensions, with several exceptions:
- A SPM Report Date Filter is required
- Other filters will change the results
- Clear Cache and Refresh should be used after changing the date range of the filter
- Only dates on or after 10/01/2012 are included, regardless of the Report Date Filter start date. Per the HUD specs, the earliest date to be used for the SPM is 10/1/2012.
Filtering
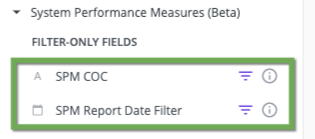
SPM Report Date Filter
All Looker System Performance Measures require the SPM Report Date Filter found in the System Performance Measures group.
This filter is required as the System Performance Measures are generated for a specific timeframe. The HUD reporting year is October 1 through September 30 for the SPM. However, the Measures will generate successfully for any date range.
If this filter is not added to the report all Measures will generate null values.
Another important note: Any filter added to the Look will impact how the Measures are created and the results that are returned.
SPM CoC
For the System Performance Measures, the SPM CoC filter should be used to filter to a particular CoC. Using any other type of CoC filtering will result in incorrect selection of client enrollments.
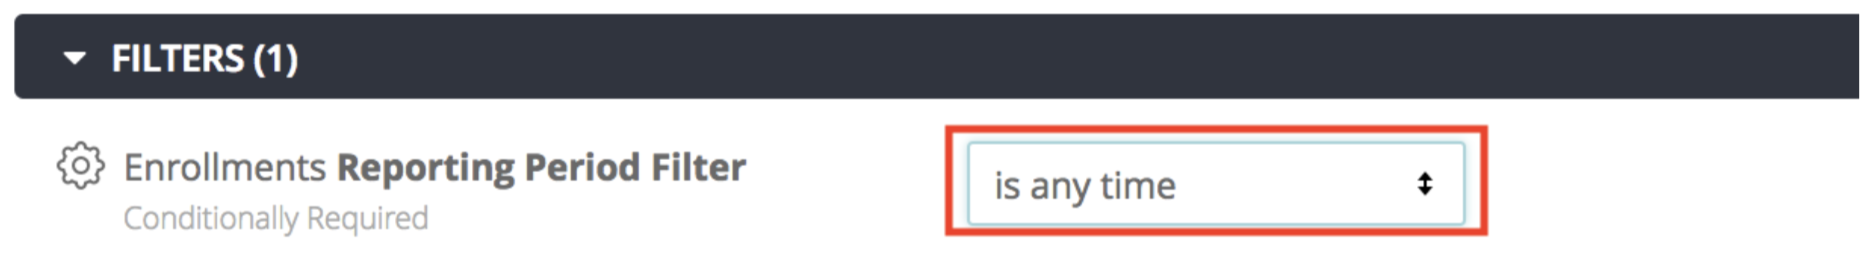
Enrollments, Reporting Period Filter
Finally, the Enrollments Reporting Period Filter should be set to Is any time.
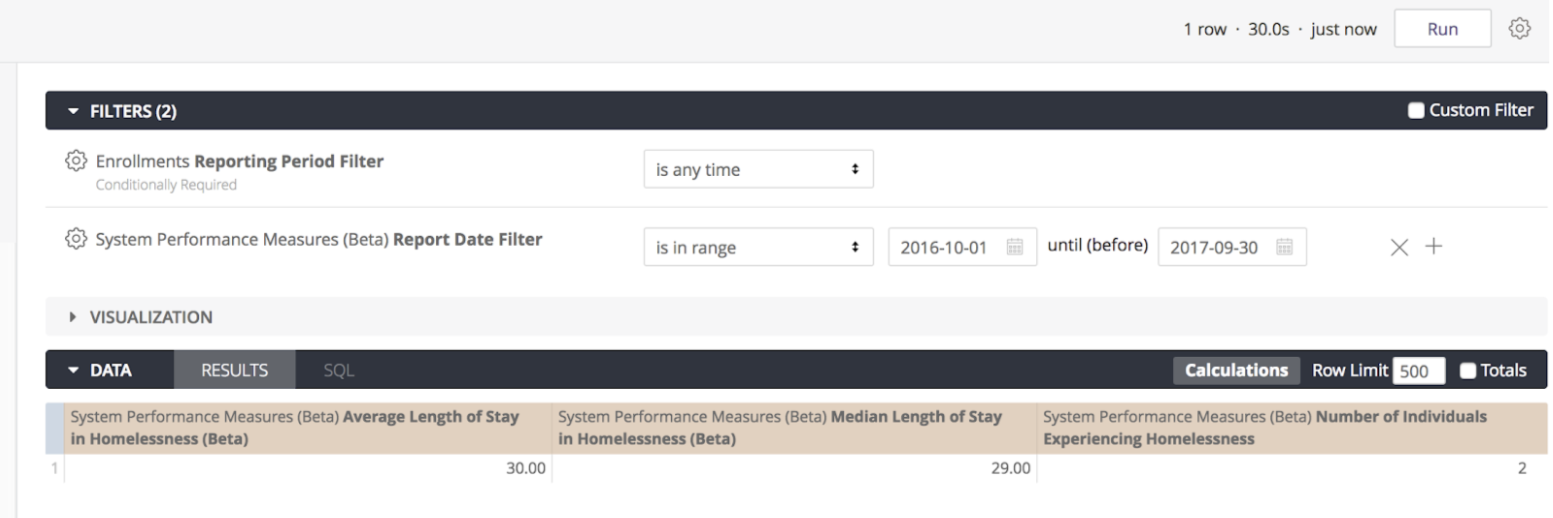
Once the SPM Report Date Filter is added, the desired date range set, and all filters set appropriately then any Measure may be added to the Look and should successfully run.
Caching
Looker usually stores the information needed for Looks to run quickly. This in case someone else wanted to run the exact same Look, without having to wait. This is known as caching.
However, caching Looks causes some unexpected behavior when running the System Performance Measures in Looker. Specifically, if the System Performance Measures are generating with one date range, the date range is changed and the Look is run again. Looker may not understand you are asking for a different date range and uses the cached Look and date range.
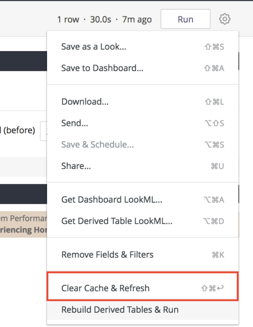
To get around this, whenever changing the date range on a System Performance Measure Look, click on the ![]() then Clear Cache and Refresh.
then Clear Cache and Refresh.
Using the SPM Measures
The SPM Measures are simply organized into one view folder in the data analysis tool. It is found in the HMIS Performance model under System Performance Measures.

Each System Performance Measure is organized into its own group. All SPM are comprised of measures. Each of the measures provided correspond to a particular SPM metric and cell. Measure 3 also includes a dimension for the the project types being evaluated.
For example:
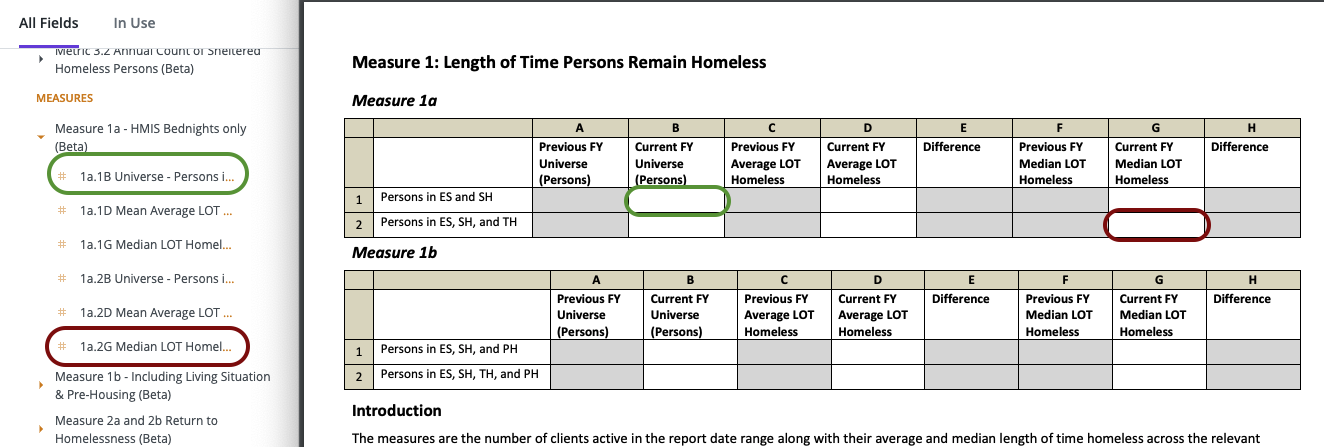
- 1a.1B Universe - Persons in ES, SH corresponds to table Measure 1a, row 1 column B
- 1a.2G Median LOT Homeless - ES, SH, TH corresponds to table Measure 1a, row 2, column G
This strategy is repeated for all the measures and metrics.
The LookML dashboard "System Performance Measures - Homelessness and Housing" presents some of the metrics from Measures 1, 5, and 7. Refer to the related help center article for more information about this dashboard.
Understanding SPM Measures and Data Quality Issues
The following articles review potential trouble spots with the data for the System Performance Measures: