Using System Performance Measures in Looker
The System Performance Measures (SPM) are meant to provide a high level assessment whether a Continuum of Care (COC) is accomplishing the goals set down by the McKinney-Vento Homeless Assistance Act.
Reviewing HUDs (Housing and Urban Development) System Performance Measures Introductory Guide is advised before exploring the measures in Looker. The Guide offers an explanation of each of the measures and how to use them in your community. For additional information on how the SPMs are calculated, please reference the System Performance Measures Programming Specifications. The SPM dimensions and measures in Looker have been created in accordance with HUD System Performance Programming Specifications and are expected to work as specified.
This article will show how to get the most information out of running the System Performance Measures in Looker. You should have a basic understanding of Looker before using these measures.
Running System Performance Measures in Looker
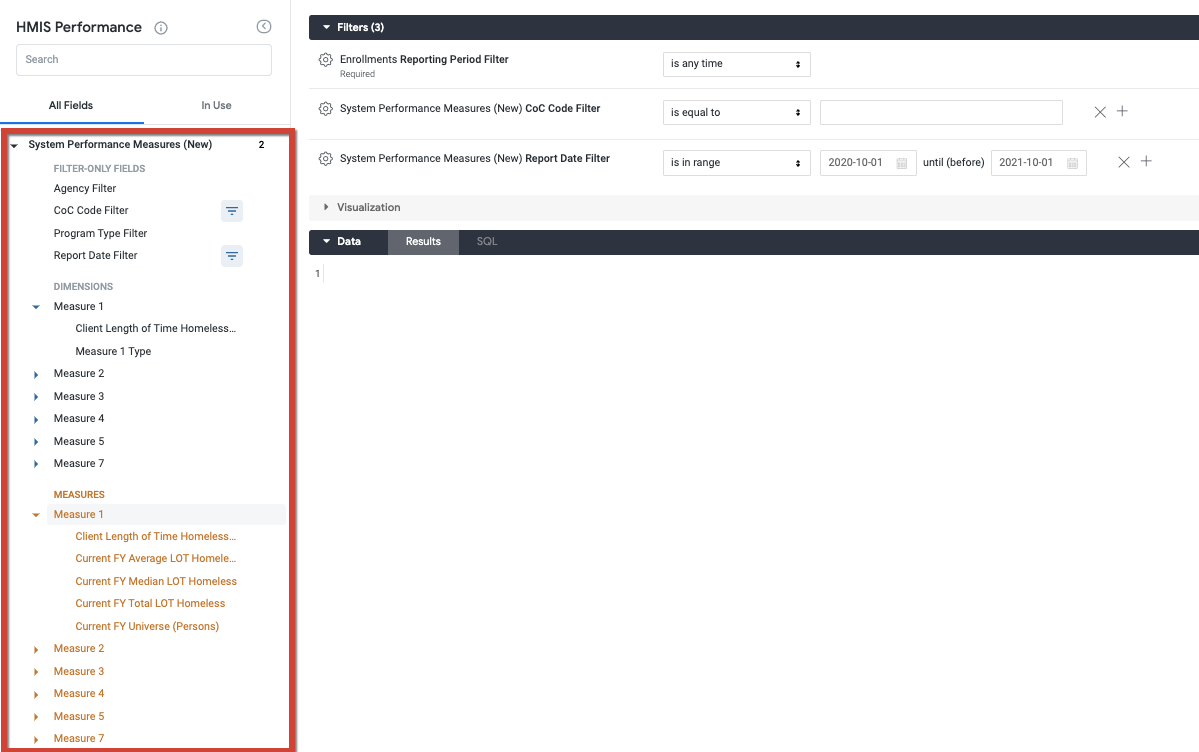
The System Performance Measures dimensions and measures are included in the HMIS Performance Looker model.
When running the SPM in Looker, please note that:
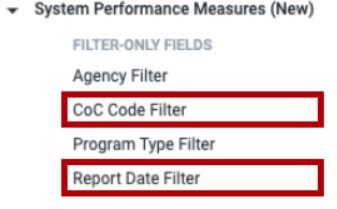
- SPM Report Date Filter island CoC Code Filters are required
- The report can be run for more than one CoC unlike the Clarity SPM report in the Report Library. However, this data set will likely be quite large and may lead to poor performance.
- Other filters will change the results
- Clear Cache and Refresh should be used after changing the date range of the filter
- Only dates on or after 10/01/2012 are included, regardless of the Report Date Filter start date.
Filtering
Report Date Filter
All Looker System Performance Measures require the Report Date Filter found in the System Performance Measures group.
This filter is required as the System Performance Measures are generated for a specific timeframe. The HUD reporting year is October 1 through September 30 for the SPM. However, the Measures will generate successfully for any date range.
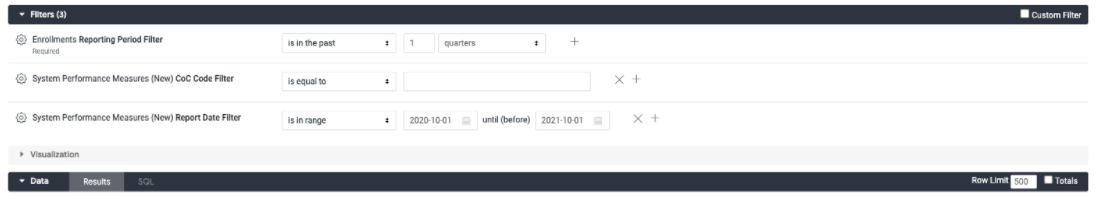
When utilizing “is in range” in the Report Date Filter, “until(before)” means you will need to add one day after your proposed reporting period. For example, if you want your date range to reflect 10/01/2020 - 09/30/2021 for 2021 SPM analysis - your end date would be 10/1/2021.
If this filter is not added to the report all Measures will generate null values.
Please note, any filter added to the Look will impact how the Measures are created and the results that are returned.

CoC Code Filter
For the System Performance Measures, the CoC Code Filter should be used to filter to a particular CoC. Using any other type of CoC filtering will result in incorrect selection of client enrollments.

Enrollments Reporting Period Filter
Finally, the Enrollments Reporting Period Filter should be set to “is any time”.

Once the Report Date Filter and CoC Code Filter are added, the desired date range set, and all filters are set appropriately then any Measure may be added to the Look and should successfully run.
Additional Filters
Additional filters have been added to the SPM Filter fields. The Agency Filter, Agency Status Filter, Program Status Filter, and Program Type Filter were added to the filter options to allow for a more in-depth analysis of the System Performance Measures. These filters can be used to highlight data from one or more agencies or to filter out program types to identify more specific data as needed.
NOTE: The SPM fields are ONLY to be used with the filters within the SPM field (Agency Filter, Agency Status Filter, CoC Code Filter, Program Status Filter, Program Type Filter, and Report Date Filter). Adding filters, dimensions, and measures outside of the SPM field is not recommended or advised as it will impact the query's runability and accuracy. Retired SPM fields are not to be utilized with the new SPM fields.
Caching
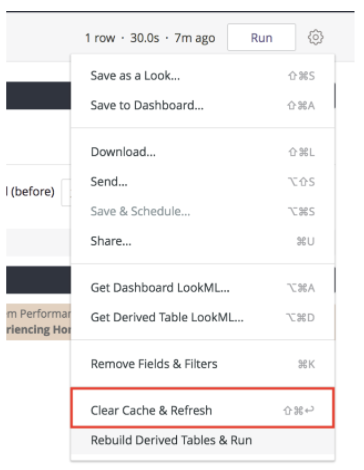
However, caching Looks causes some unexpected behavior when running the System Performance Measures in Looker. Specifically, if the System Performance Measures are generated with one date range, the date range is changed and the Look is run again. Looker may not understand you are asking for a different date range and uses the cached Look and date range.
To get around this, whenever changing the date range on a System Performance Measure Look, click on the ![]() icon, then “Clear Cache and Refresh”.
icon, then “Clear Cache and Refresh”.
Using the System Performance Measures (SPM)
The SPM dimensions and measures are simply organized into one view folder in the data analysis tool. It is found in the HMIS Performance model under System Performance Measures.
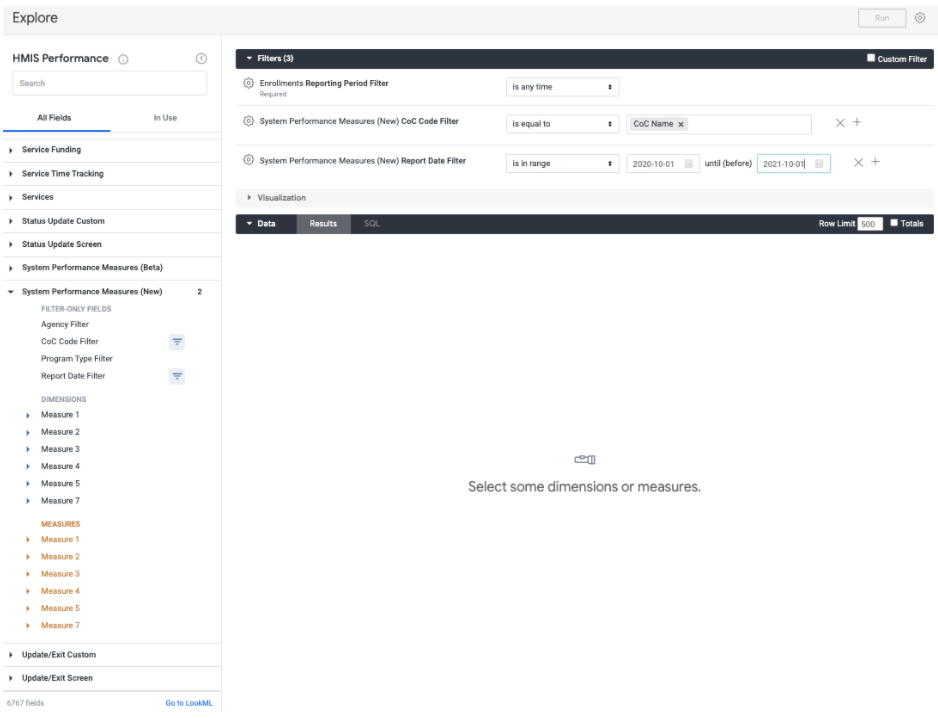
Each System Performance Measure is organized into its own group. All SPMs are comprised of the measures and associated metrics. Each of the measures provided align with their corresponding SPM measure, metrics and calculations for analysis and exploration. The measure and dimension titles in Looker align with the naming conventions in the SPM specifications and the Clarity SPM report.
For example:
- Measure 1: Current FY Universe (Persons) corresponds to Column B in table Measure 1a and Measure 1b.
- Measure 1: Current FY Average LOT Homeless corresponds to Column D in table Measure 1a and Measure 1b.
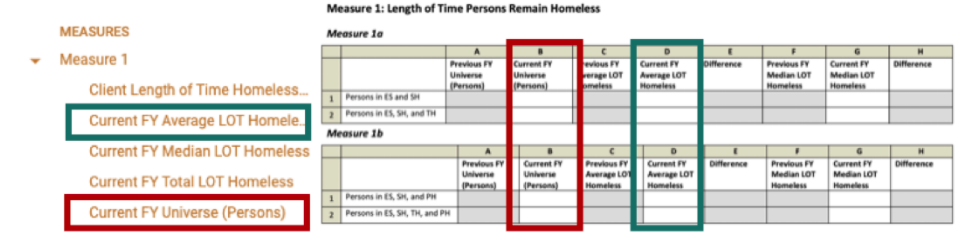
This strategy is repeated for all the measures and metrics.
There are a few measures that will require the manual input of table calculations. These steps and formulas are outlined step by step in the SPM articles. These calculations were not built into the fields as it would negatively impact Looker performance.
Additional dimensions can be added into your SPM Looks for further analysis. Listed below are just a few dimensions that can aid in SPM analysis and to find/fix errors:
- Agencies - Agency Name
- Agencies - Agency Type
- Clients - Unique Identifier
- Clients - User Created
These Looks can also be saved to create your own custom SPM Analysis Dashboards.
The SPM dimensions and measures can be utilized to acquire a custom analysis catered to your CoC’s needs.
Understanding SPM Measures and Data Quality Issues
The following articles review potential troublespots with the data for the System Performance Measures:
- Overview of SPM Requirements
- Measure 1: Length of Time Homeless
- Measure 2: Returns to Homelessness
- Measure 3: Number of Homeless Persons
- Measure 4: Employment and Income Growth for Homeless Persons in CoC Program-funded Projects
- Measure 5: Number of Persons who Become Homeless for the First Time
- Measure 7: Successful Placement from Street Outreach and Successful Placement in or Retention of Permanent Housing
Updated: 06/21/2022