Purpose
The purpose of the System Performance Measure dashboard is to allow convenient review of your community’s performance. Utilizing reporting date, CoC and agency filters allow a quick, easy and customizable way to review your community’s data at any given time.
It is recommended to review and understand the System Performance Measures (SPMs) prior to utilizing these dashboards. The System Performance Measures Programming Specifications and System Performance Measure Introductory Guide provide a comprehensive overview of the SPMs and how they are calculated. In addition to these HUD resources, further information about the SPMs and how to use them in Looker are available in our Help Center articles under Data Analysis in the System Performance Measures section.
These dashboards, in tandem with the SPM report in the Clarity Report Library and exploring the SPM fields in Looker, can assist data analysis efforts to improve and audit system performance with ease.
Due to the complexity of this data set, the dashboard has been split into two dashboards to separate Measure 1. The dashboards are clearly labeled "System Performance Measures" and "System Performance Measures (Measure 1)".
Dashboard Details
The dashboards are accessible in Looker by utilizing the following pathway:
- “All Folders”
- “LookML Dashboards”
- "System Performance Measures"
- Contains measures 2-5 and 7
- "System Performance Measures (Measure 1)"
- "System Performance Measures"
- “LookML Dashboards”
Once selected, your dashboard will begin to run. The System Performance Measures dashboards utilize the HMIS Performance Model and the new System Performance Measure fields. For more information about the measure/metric highlighted in the tile, hover over the information bubble in the title.
Filters
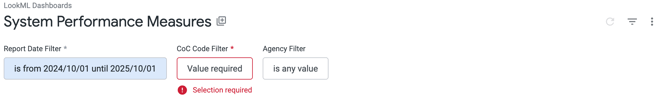
There are three dashboard filters on the System Performance Measures dashboards that apply to all tiles.
- Report Date Filter allows you to select the reporting period for the dashboard. With this filter, you can mimic the SPM reporting periods (e.g., 2020/10/01 - 2021/10/01 for FY2021 SPMs) or select time frames outside of the typical SPM reporting periods to track your community’s performance at any given time. This filter is required.
- CoC Code Filter is another required filter. Select the CoC Code to update the dashboard to your community if you have access to more than one CoC. Once you select your CoC, select run. The dashboards will not run if a CoC Code is not selected even if only one CoC is available. Select a CoC Code to review and then click on the update button in the upper right corner.
- Agency Filter is not required. Utilizing this filter will allow you to select one or more agencies to include in the dashboard.
Tile Overview
The dashboard contains 12 tiles to visualize and explore Measures 1, 2, 3, 4, 5 and 7. Measure 1 is kept separate from the main dashboard and only contains 1 of the 12 tiles. This tile overview will highlight a brief description of each tile, the dimensions and measures used and what to expect when “Explore the Look” is selected.
Note: Depending on the size of the data set when exploring a Look, select “Download Results” to see all rows.
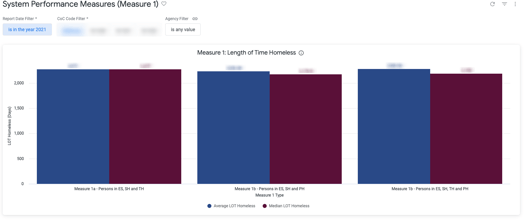
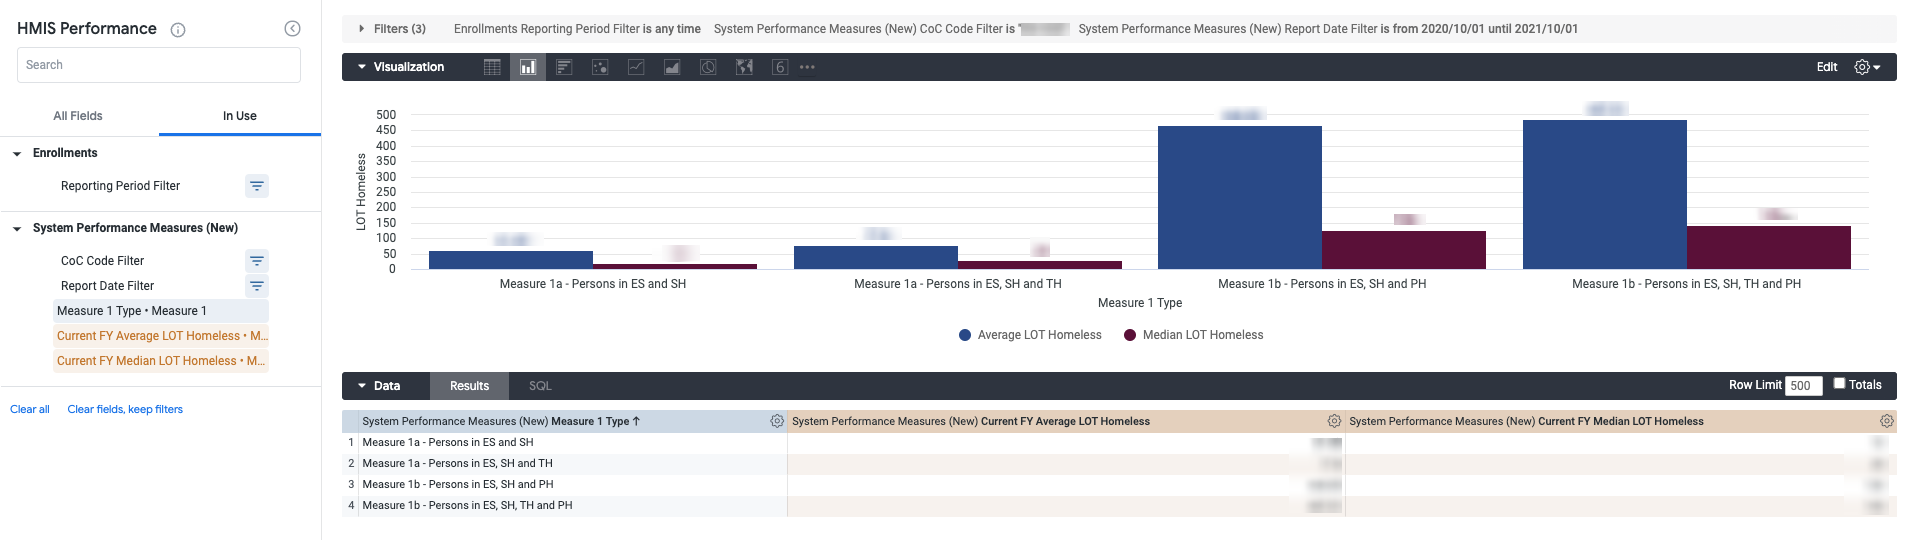
Measure 1: Length of Time (LOT) Homeless
This Look contains average and median length of time homeless for the selected reporting period for Measure 1a and 1b and is featured on the System Performance Measures (Measure 1) dashboard.
Note: Measure 1 requires a multitude of complex calculations on a large amount of data within the system. Due to the complexity of this measure, loading this Look can take anywhere from 20 minutes to 2 hours depending on the size of your community and the data set.
- Dimensions
- Measure 1 Type
- Measures
- Current FY Average LOT Homeless
- Current FY Median LOT Homeless
- “Explore from Here”
- There are no drills available for this Look. For more information about conducting further analysis with Measure 1 fields, please review the Measure 1: Length of Time Homeless Help Center article.
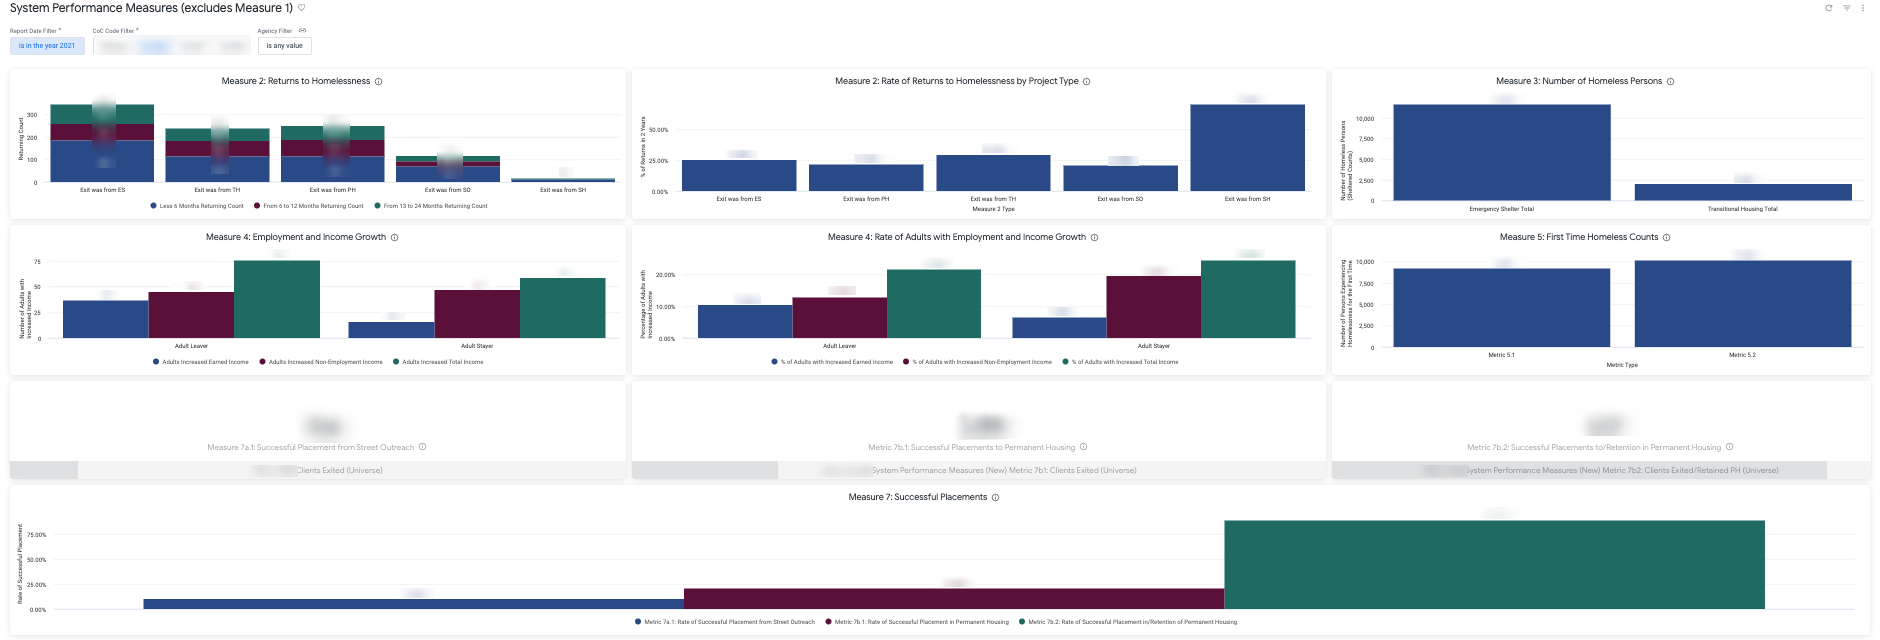
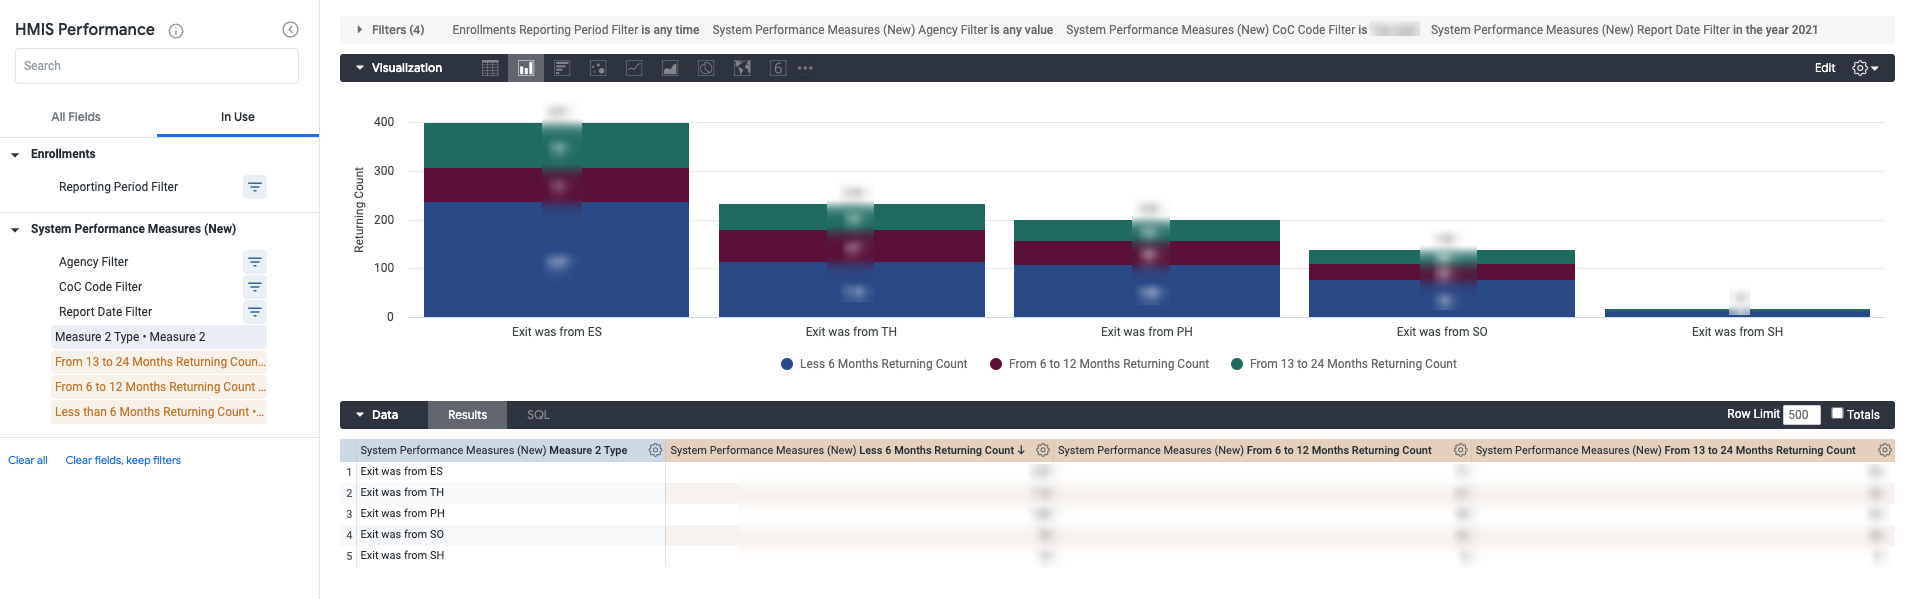
Measure 2: Returns to Homelessness
This Look contains counts of returns to homelessness by return duration and exited program.
- Measures
- Measure 2 Type
- Dimensions
- Less than 6 Months Returning Count
- From 6 to 12 Months Returning Count
- From 13 to 24 Months Returning Count
- “Explore from Here”
- For more information on these clients, select any count from the returning count columns for a client list containing Personal ID, Unique Identifier, Permanent Exit Information Date, Re-Entry Information Date and Days Returning Duration.
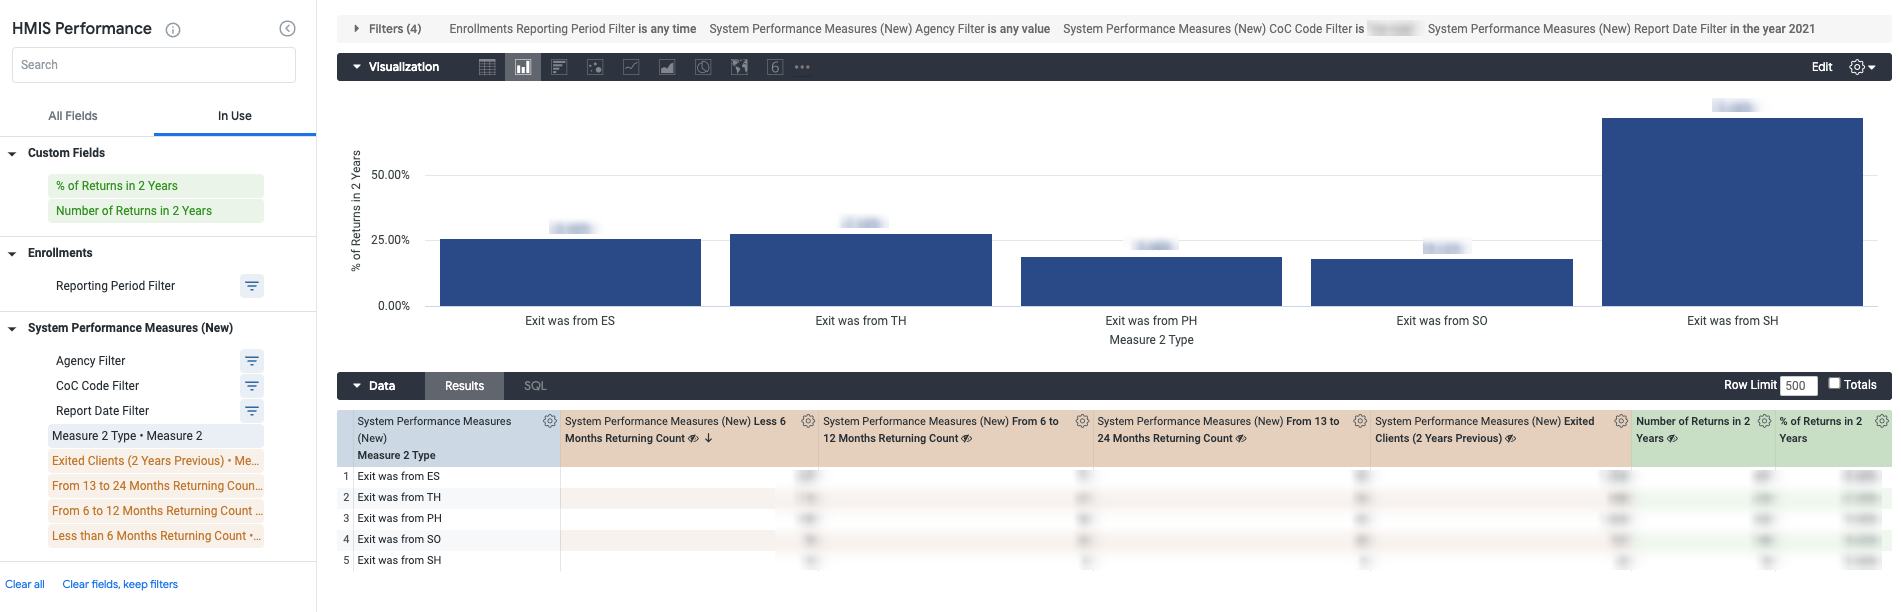
Measure 2: Rate of Returns to Homelessness by Project Type
This Look contains the rate of returns to homelessness by the exited program project type utilizing all exits from the program and the returning count.
- Dimensions
- Measure 2 Type
- Measures
- Less than 6 Months Returning Count*
- From 6 to 12 Months Returning Count*
- From 13 to 24 Months Returning Count*
- Custom Fields
- Table Calculations
- % of Returns in 2 Years
- Number of Returns in 2 Years
- Table Calculations
- “Explore from Here”
- For more information on these clients, select any count from the returning count columns for a client list containing Personal ID, Unique Identifier, Permanent Exit Information Date, Re-Entry Information Date and Days Returning Duration.
- Exploring the Look exposes a “Totals” row and the measures listed above as they are hidden from the visualization.
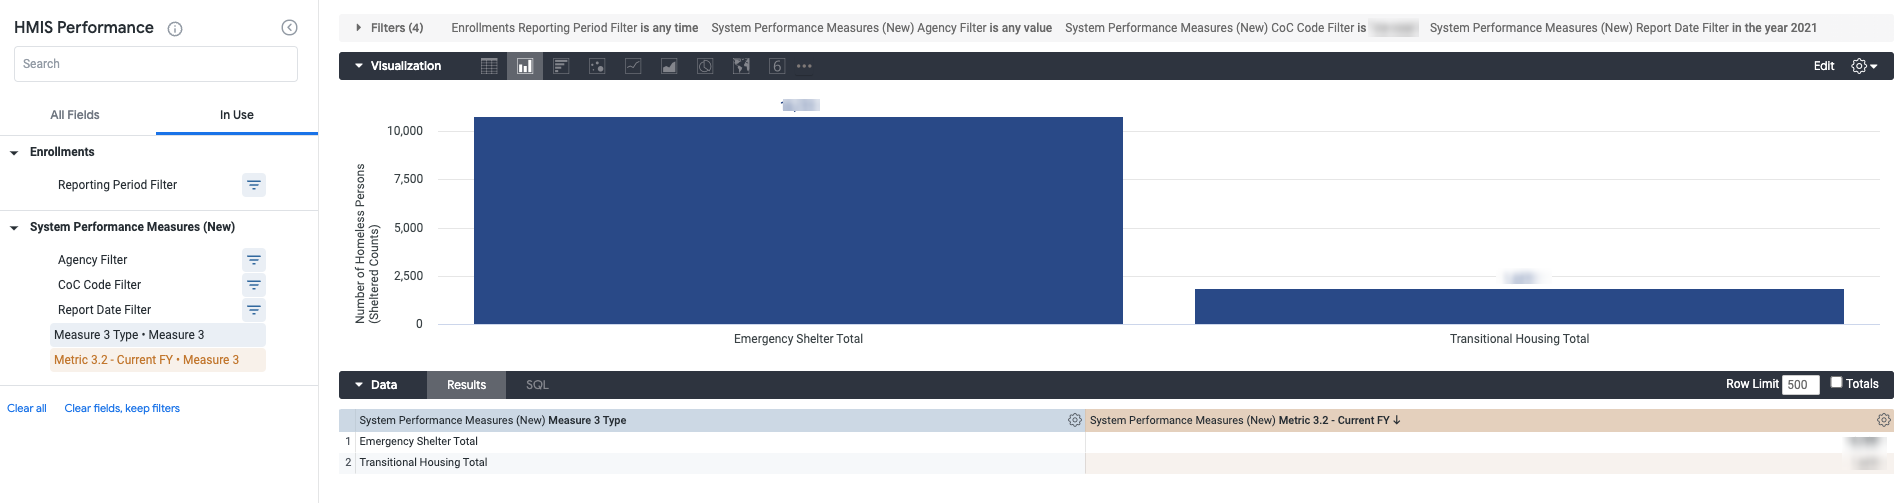
Measure 3: Number of Homeless Persons
This Look contains the number of persons experiencing homelessness for the chosen reporting period. These counts are specific to persons accessing Emergency Shelter, Transitional Housing or Safe Haven. The data table and visualization will only display applicable shelter program types as seen in the example below. The sample community for this Look only had counts for Emergency Shelter and Transitional Housing.
- Dimensions
- Measure 3 Type
- Measures
- Metric 3.2 - Current Year
- “Explore from Here”
- For more information on these clients, select any count from the Metric 3.2 - Current FY columns for a client list containing Personal ID, and Unique Identifier for all clients for the corresponding row project type.
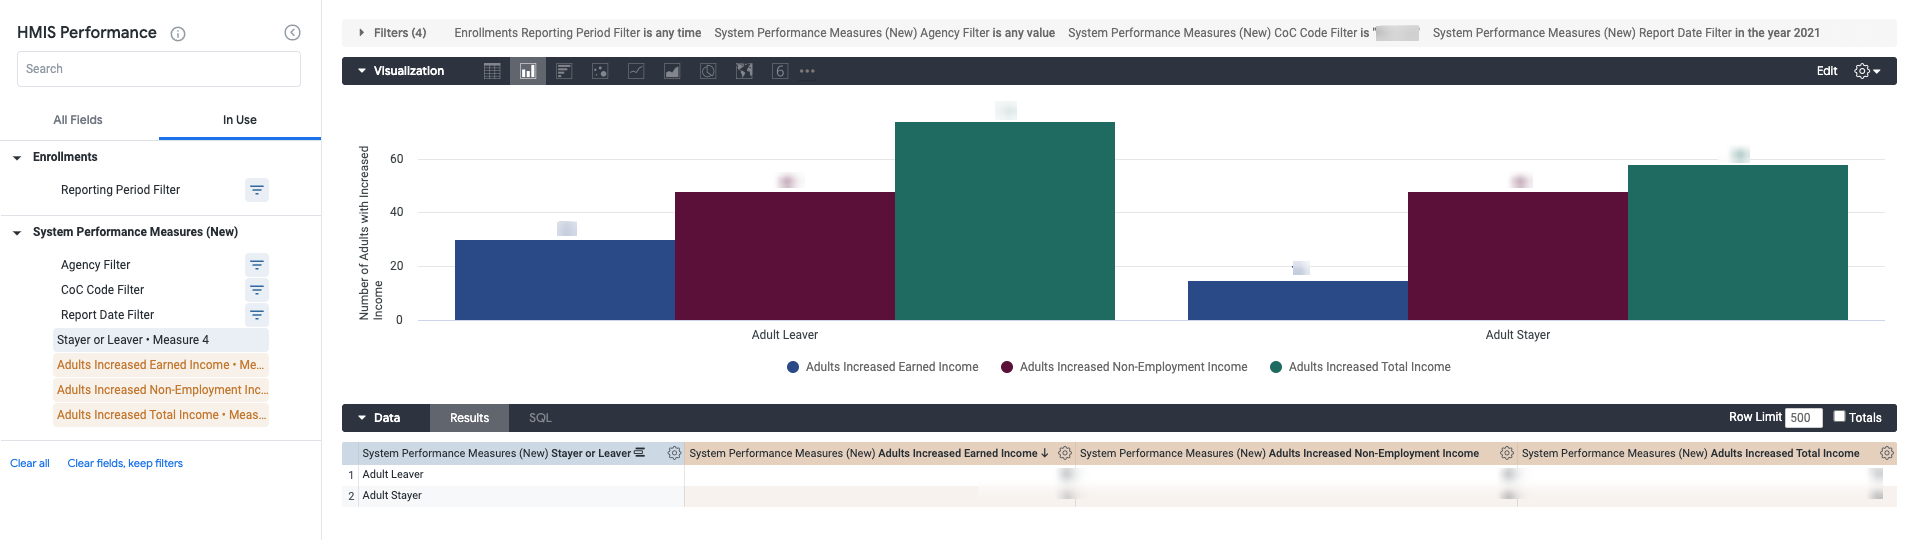
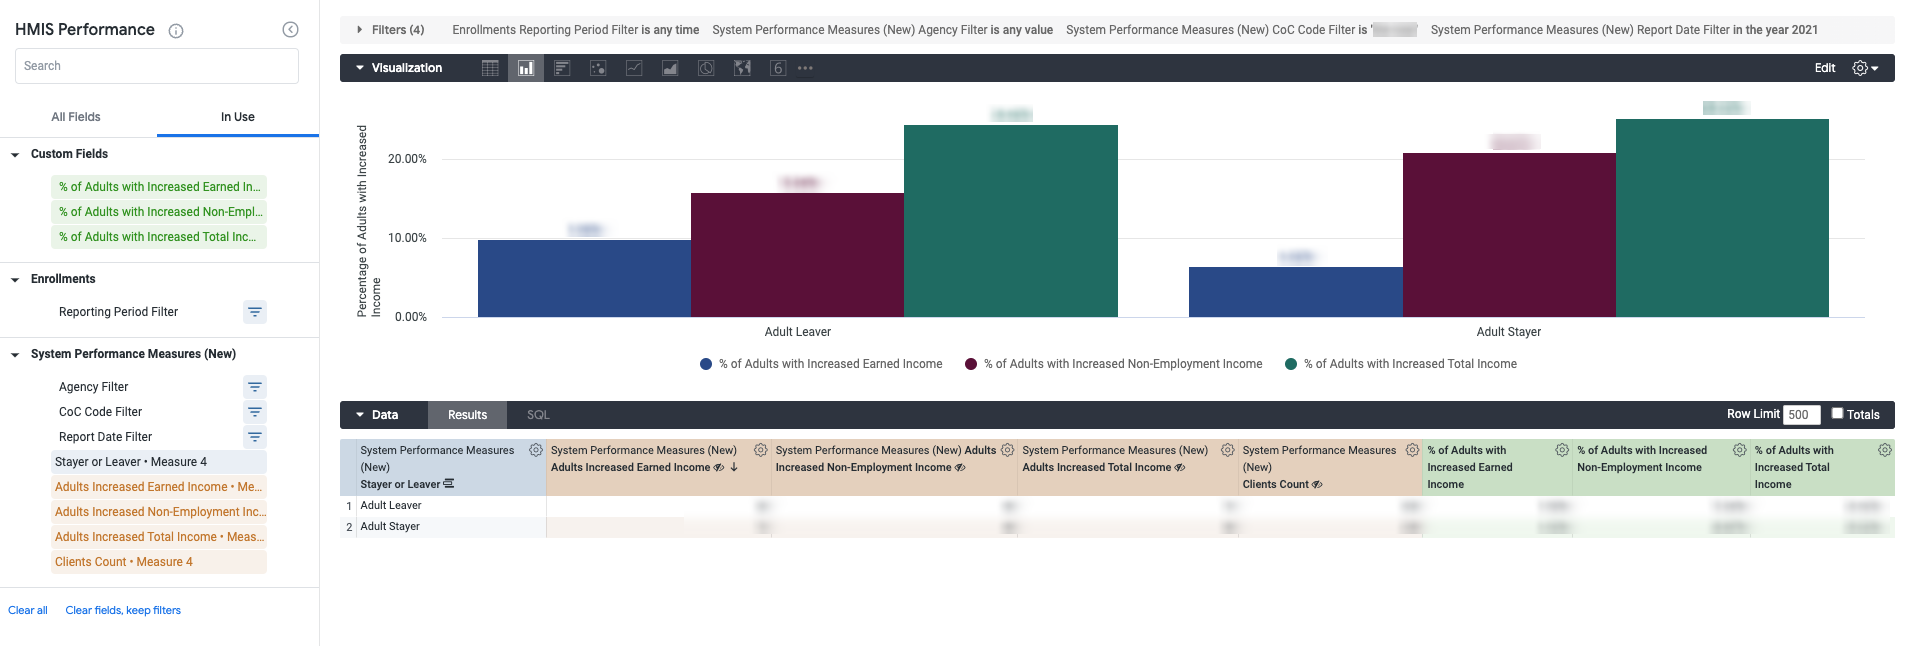
Measure 4: Employment and Income Growth
This Look contains counts for adult stayers/leavers that have increased their earned, non-employment or total income during the reporting period.
- Dimensions
- Stayer or Leaver
- Measures
- Adults Increased Earned Income
- Adults Increased Non-Employment Income
- Adults Increased Total Income
- “Explore from Here”
- For more information on these clients, select any count from the increased income columns for a client list containing Personal ID, Unique Identifier, Stayer or Leaver, Earlier Assessment Enrollment ID, Earlier Income Information Date, Earlier Income Amount, Later Assessment Enrollment ID, Later Income Information Date, Later Income Amount, and Income Earned Update Amount.
Measure 4: Rate of Adults with Employment and Income Growth
This Look contains the rate of adult stayers/leavers that have increased their earned, non-employment or total income during the reporting period.
- Dimensions
- Stayer or Leaver
- Measures
- Adults Increased Earned Income*
- Adults Increased Non-Employment Income*
- Adults Increased Total Income*
- Clients Count*
- Custom Fields
- Table Calculations
- Percentage of Adults with Increased Earned Income
- Percentage of Adults with Increased Non-Employment Income
- Percentage of Adults with Increased Total Income
- Table Calculations
- “Explore from Here”
- For more information on these clients, select any count from the increased income or client count columns for a client list containing Personal ID, Unique Identifier, Stayer or Leaver, Earlier Assessment Enrollment ID, Earlier Income Information Date, Earlier Income Amount, Later Assessment Enrollment ID, Later Income Information Date, Later Income Amount, and Income Earned Update Amount.
- Exploring the Look exposes a “Totals” row and the measures listed above as they are hidden from the visualization.
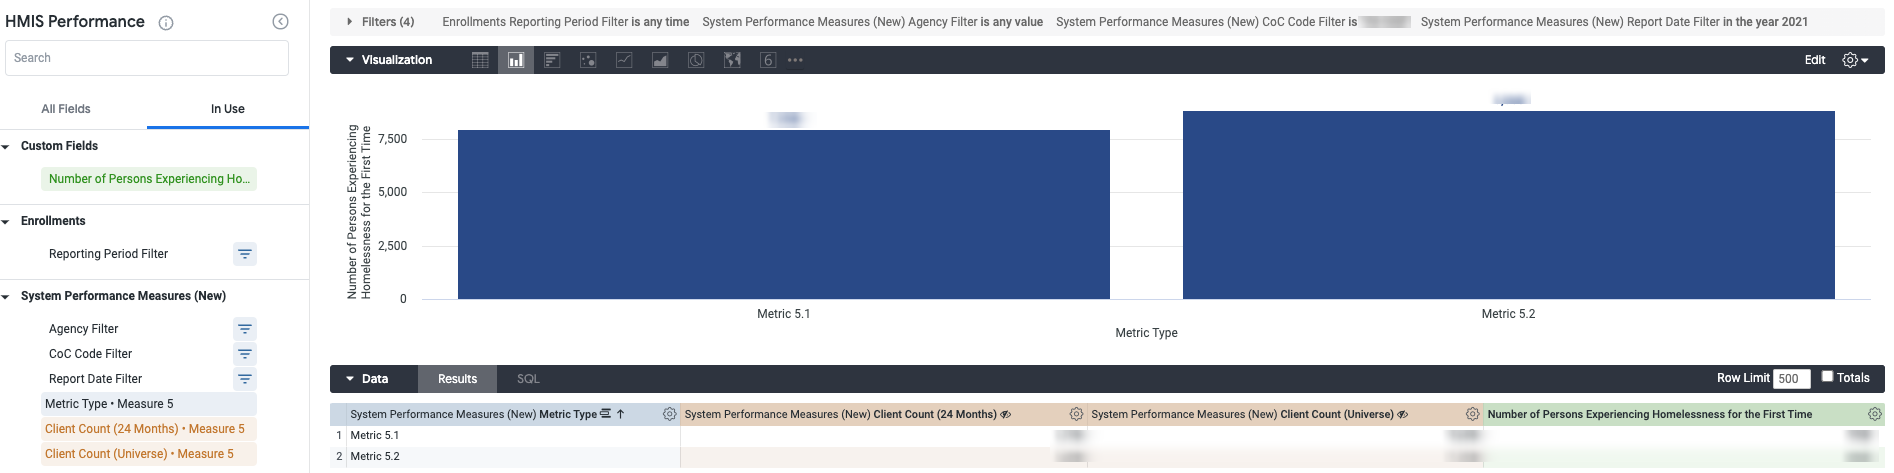
Measure 5: First Time Homeless Counts
This Look contains counts of persons experiencing homelessness for the first time for metric 5.1 and 5.2 for the selected reporting period.
- Dimensions
- Metric Type
- Measures
- Client Count (24 Months)*
- Client Count (Universe)*
- Custom Fields
- Table Calculation
- Number of Persons Experiencing Homelessness for the First Time
- Table Calculation
- “Explore from Here”
- For more information on these clients, select the counts in the three measures columns for client lists containing Personal ID, Unique Identifier, Enrollment ID (Universe) and Enrollment ID (24 Months)
- Exploring the Look exposes the measures listed above as they are hidden from the visualization.
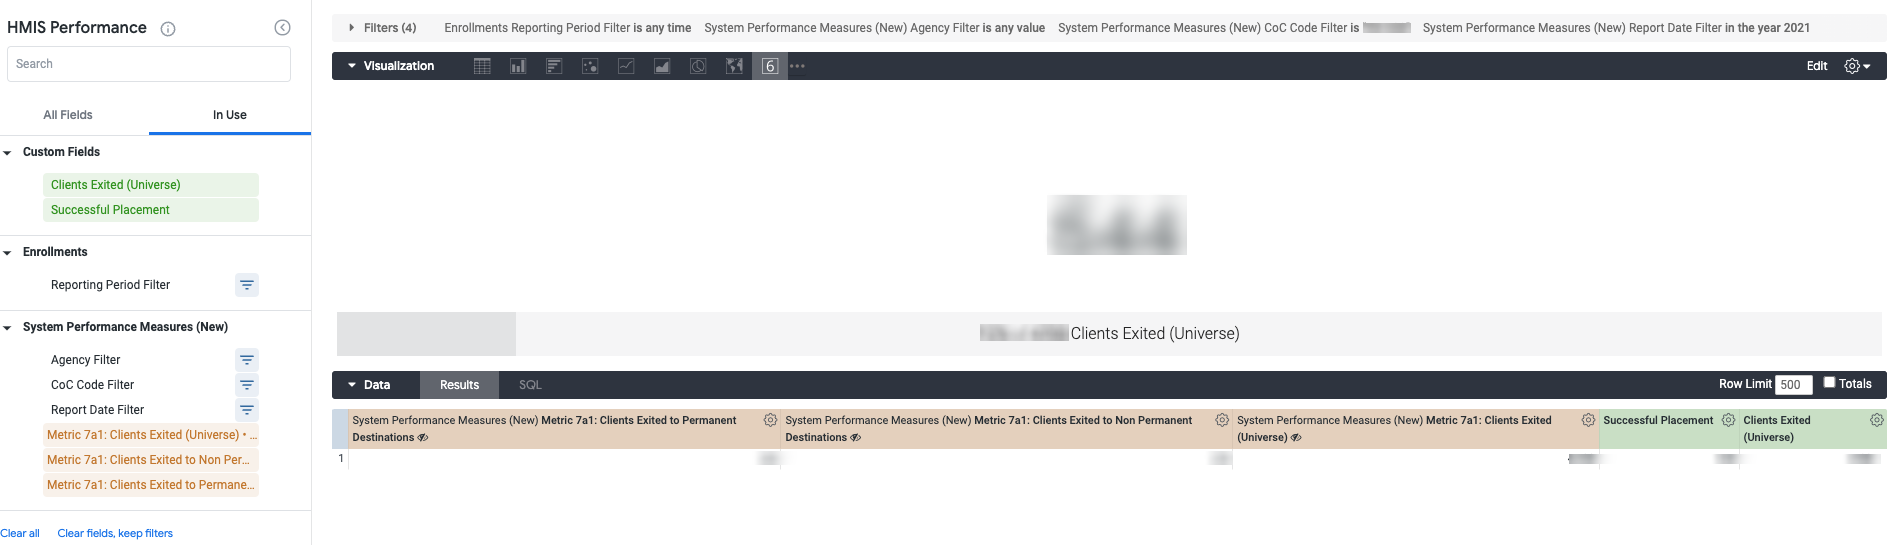
Metric 7a.1: Successful Placement from Street Outreach
This Look contains the count of successful placements to permanent and nonpermanent destinations from street outreach programs and the rate of successful placements within the appropriate client universe for the selected reporting period.
- Measures
- Metric 7a1: Clients Exited (Universe)*
- Metric 7a1: Clients Exited to Non-Permanent Destinations*
- Metric 7a1:Clients Exited to Permanent Destinations*
- Custom Fields
- Table Calculations
- Successful Placement
- Clients Exited (Universe)
- Table Calculations
- “Explore from Here”
- For more information on these clients, select any count in the measures columns for a client list containing Personal ID, Unique Identifier, Enrollment ID and Exit Destination.
- Exploring the Look exposes the measures listed above as they are hidden from the visualization.
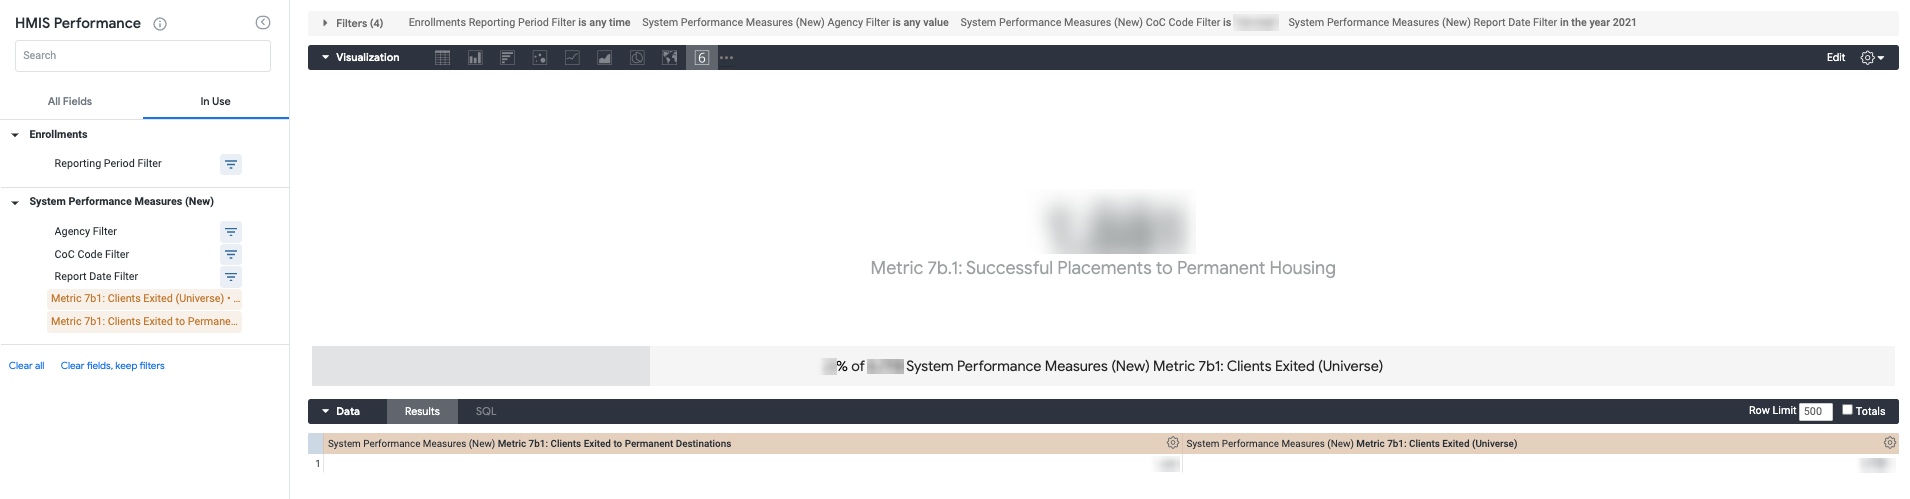
Metric 7b.1: Successful Placements to Permanent Housing
This Look contains the count of successful placements to permanent housing and the rate of successful placements within the appropriate client universe for the selected reporting period.
- Measures
- Metric 7b1: Clients Exited (Universe)*
- Metric 7b1: Clients Exited to Permanent Destinations*
- “Explore from Here”
- For more information on these clients, select any count in the measures columns for a client list containing Personal ID, Unique Identifier, Enrollment ID and Exit Destination.
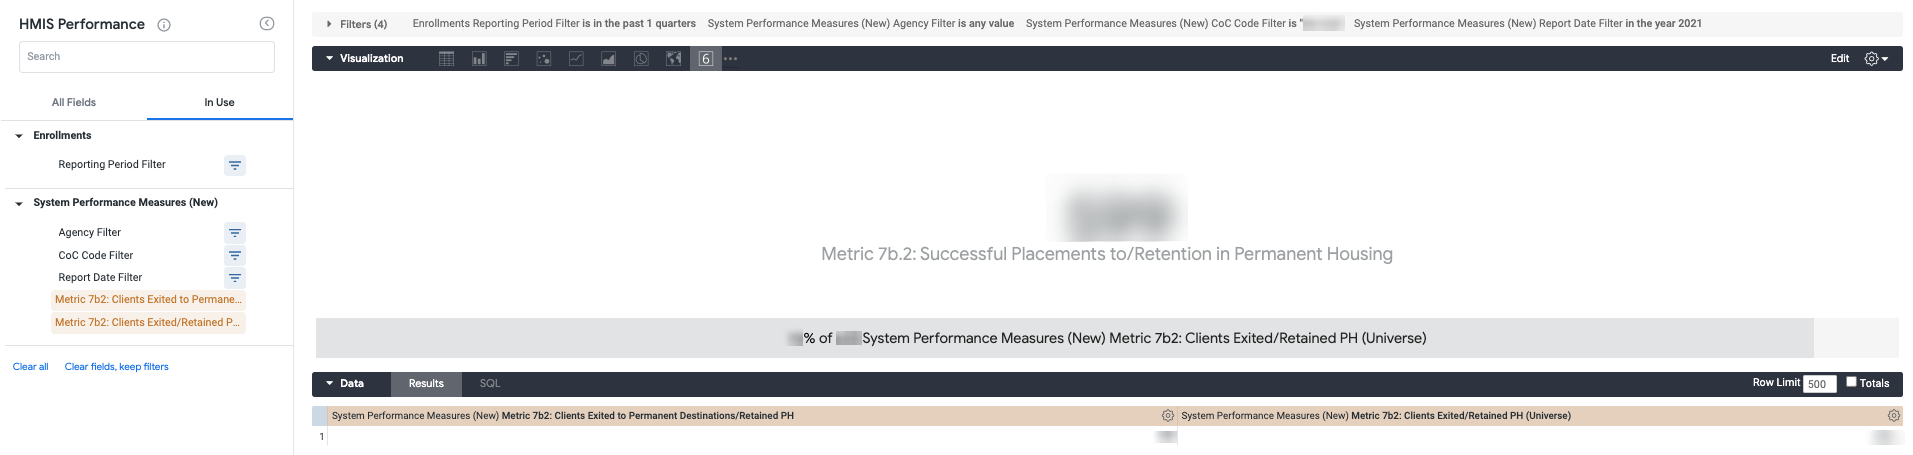
Metric 7b.2: Successful Placements to and Retention in Permanent Housing
This Look contains the count of successful placements to and retention in permanent housing and the rate of successful placements within the appropriate client universe for the selected reporting period.
- Measures
- Metric 7b2: Clients Exited/Retained PH (Universe)*
- Metric 7b2: Clients Exited to Permanent Destinations/Retained PH*
- “Explore from Here”
- For more information on these clients, select any count in the measures columns for a client list containing Personal ID, Unique Identifier, Enrollment ID and Exit Destination.
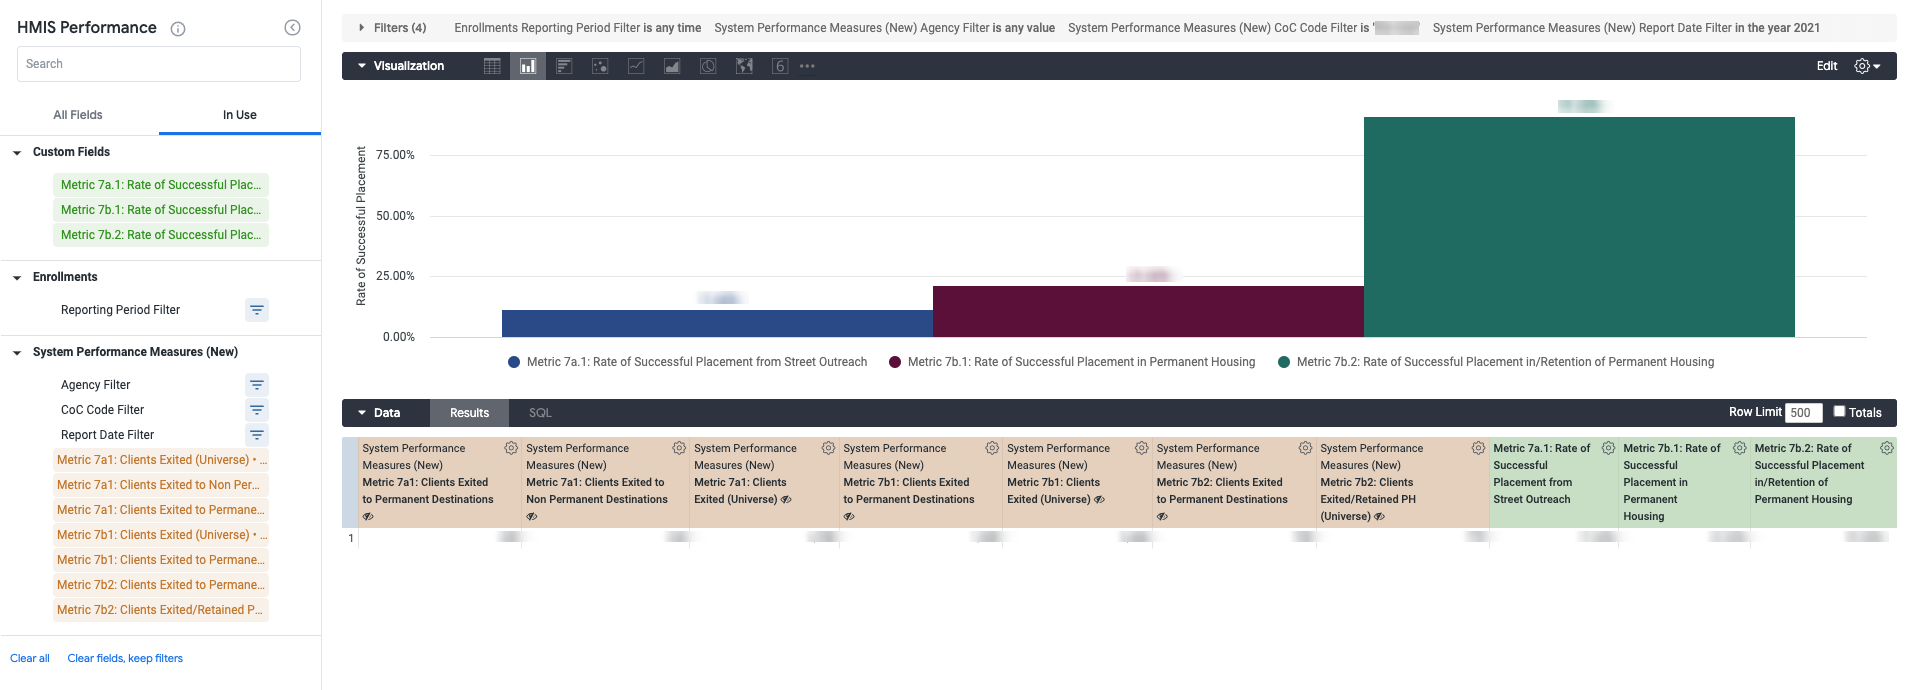
Measure 7: Successful Placements
This Look contains the rate of successful placements within the appropriate client universes for all of three Measure 7 metrics for the selected reporting period.
- Measures
- Metric 7a1: Clients Exited (Universe)*
- Metric 7a1: Clients Exited to Non-Permanent Destinations*
- Metric 7a1:Clients Exited to Permanent Destinations*
- Metric 7b1: Clients Exited (Universe)*
- Metric 7b1:Clients Exited to Permanent Destinations*
- Metric 7b2: Clients Exited/Retained PH (Universe)*
- Metric 7b2:Clients Exited to Permanent Destinations/Retained PH*
- Custom Fields
- Table Calculations
- Metric 7a1: Rate of Successful Placement from Street Outreach
- Metric 7b1: Rate of Successful Placement in Permanent Housing
- Metric 7b2: Rate of Successful Placement to/Retention in Permanent Housing
- Table Calculations
- “Explore from Here”
- Exploring this Look provides the same drilldown functionality as the Looks for Metric 7a1, 7b1 and 7b2. See above for further details and select the appropriate metric-specific columns.
*This measure is hidden from the visualization but can be seen by selecting “Explore the Look”.
For more information about the System Performance Measures and the SPM fields in Looker, review the following articles:
-
- System Performance Measures - New
- Measure 1: Length of Time Homeless
- Measure 2: Returns to Homelessness
- Measure 3: Number of Homeless Persons
- Measure 4: Employment and Income Growth for Homeless Persons in CoC Program-funded Projects
- Measure 5: Number of Persons who Become Homeless for the First Time
- Measure 7: Successful Placement from Street Outreach and Successful Placement in or Retention of Permanent Housing
Updated: 10/15/2025