Measure 4 has the most metrics (6 to be exact) so this article will look a bit lengthy, but these metrics all track slightly different versions of the same thing - increases in income (whether it is employment/earned income, non-employment income like SSI/SSDI) or total income for individuals that stayed in or left a project.
Overview of Measure 4
This measure is divided into six tables. These metrics are calculated with different income types and client universes but the project types (limited to CoC-funded projects) reported remain consistent.
There are 2 different client universes for this measure - systems stayers and system leavers.
The guidance for program specifications for these defining client universes can be found in the HUD System Performance Measures Programming Specifications and are as follows:
“For system stayers (metrics 4.1, 4.2, and 4.3):
- A “system stayer” is a client active in any one or more of the relevant projects as of the [report end date].
- The client must have at least 365 days in latest stay to be included in this measure.
- The client must be an adult to be included in this measure.
- Use data from each system stayer’s latest assessment up to or on the [report end date] and compare this data to the client’s most recent assessment prior to that one. This may be either an annual assessment or project start data, whichever is later.
For system leavers (metrics 4.4, 4.5, and 4.6):
- A “system leaver” is any client who has exited from one or more of the relevant projects between [report start date] and [report end date] and who is not active in any of the relevant projects as of the [report end date].
- The client must be an adult to be included.
- Use data from each system leaver’s income assessment at project exit and compare this data to the client’s income assessment at project start.“
Refer to the HUD System Performance Measures Programming Specifications for additional details about how the report is programmed.
Keys to Measure 4 Success
The major key to success for this measure is to ensure all clients have accurate income (employment and non-employment) information and are connected to mainstream benefit sources and case management services when applicable and appropriate.
It is important that data entry staff ensures accurate monthly income information at entry, updates and exit. Data entry staff should review and ensure that annual cost-of-living adjustments (COLA) are entered for clients receiving Social Security benefits at the beginning of each year as well as entering client reported raises or changes in income for employment income.
Annual assessments and status updates are key to accurate client information. How Do I Conduct a Program Status/Annual Assessment? and Data Quality: Annual Assessment Due are Help Center articles that provide additional guidance on how to enter these updates and to a client’s need for an annual assessment.
|
“System Stayers” |
“System Leavers” |
|
|
Earned Income (Employment) |
Metric 4.1 – Change in earned income for adult system stayers during the reporting period |
Metric 4.4 – Change in earned income for adult system leavers |
|
Non-Employment Cash Income (SSI, SSDI, General Assistance, TANF, Retirement Income, Child Support, etc.) |
Metric 4.2 – Change in non-employment cash income for adult system stayers during the reporting period |
Metric 4.5 – Change in non-employment cash income for adult system leavers |
|
Total Income (Earned & Non-Employment Income) |
Metric 4.3 – Change in total income for adult system stayers during the reporting period |
Metric 4.6 – Change in total income for adult system leavers |
Using System Performance Measures in Looker: Measure 4
Measure 4, as stated prior, has 6 metrics. To mimic the 6 tables in the programming specifications would require creation of 6 different Looks and a custom field - table calculation to align with the metric. However, due to the nature of the 6 metrics, only 3 Looks are required.
The table below depicts which looks will be made in tandem - separating these looks can be done easily utilizing filters and will be outlined.
|
“System Stayers” |
“System Leavers” |
|
Metric 4.1 – Change in earned income for adult system stayers during the reporting period |
Metric 4.4 – Change in earned income for adult system leavers |
|
Metric 4.2 – Change in non-employment cash income for adult system stayers during the reporting period |
Metric 4.5 – Change in non-employment cash income for adult system leavers |
|
Metric 4.3 – Change in total income for adult system stayers during the reporting period |
Metric 4.6 – Change in total income for adult system leavers |
NOTE: The SPM fields are ONLY to be used with the filters within the SPM field (Agency Filter, Agency Status Filter, CoC Code Filter, Program Status Filter, Program Type Filter and Report Date Filter). Adding filters, dimensions and measures outside of the SPM field is not recommended or advised as it will impact the queries runability and accuracy.
To Match the Clarity SPM Report
To recreate the Clarity SPM Report from the Report Library with the Looker dimensions and measures follow the steps below. The filters will remain the same for each Look - the filters listed below and a stayer or leaver filter for each metric (outlined in the step by step Look guidance).
Note: Table Calculations are to be added in after the initial Look has been run.
Filters
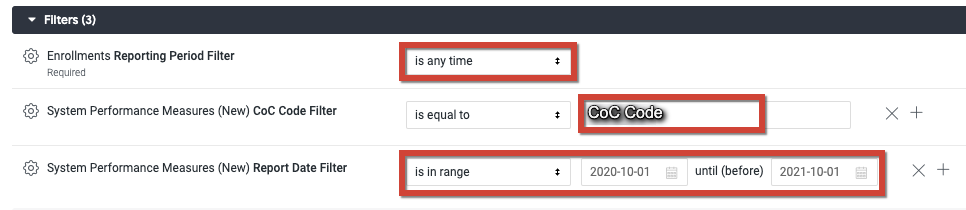
Select your filters. The following filters are required.
- CoC Code Filter
- Report Date Filter
- System Performance Measures (New) Report Date Filter end date should reflect one day after your intended range. For example if you want your data to reflect 10/01/2020 - 09/30/2021, your report date range will be:
-png.png)
- Enrollments Report Period Filter will be included automatically.
- Set filter to “is any time”.
The following filter is optional.
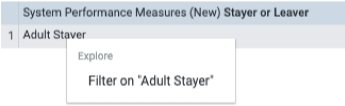
- Stayer or Leaver Filters
- Filter to Stayers only by clicking “Adult Stayer” and then “Filter on “Adult Stayer””
-
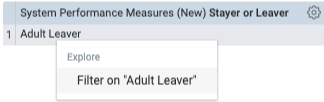
- Filter to Leavers only by clicking “Adult Leaver” and then “Filter on “Adult Leaver””
-
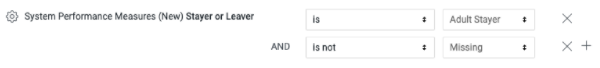
- Once the initial Stayer/Leaver filter is created:
- Add in a filter for “is not Missing”
- Utilize the dropdown options in the filter section to update as needed
- Once the initial Stayer/Leaver filter is created:
Metric 4.1 – Change in earned income for adult system stayers
Metric 4.4 – Change in earned income for adult system leavers
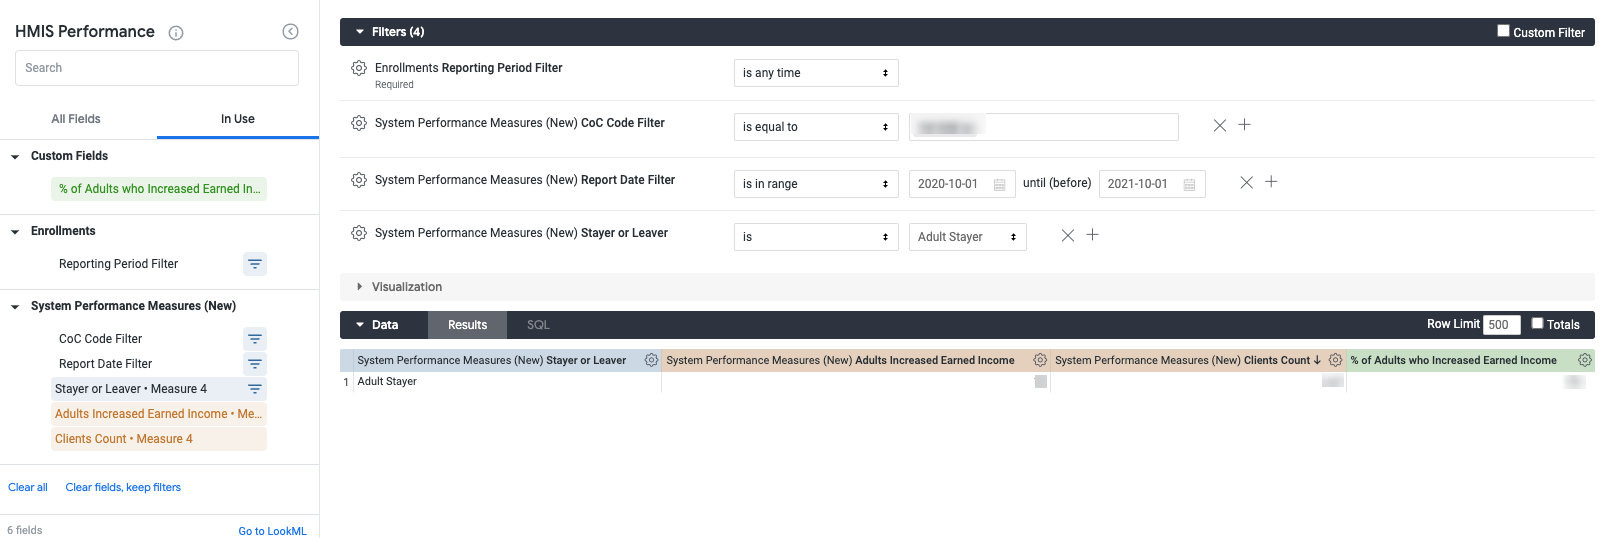
Dimensions
- Stayer or Leaver
Measures
- Adults Increased Earned Income
- Clients Count
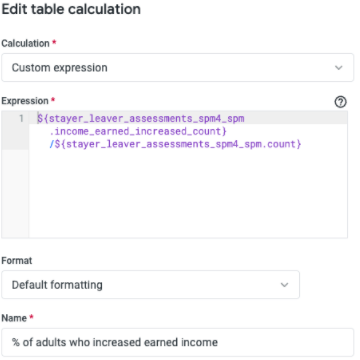
Custom Field
- Table Calculation: Percentage of Adults who Increased Earned Income
-
- ${stayer_leaver_assessments_spm4_spm.income_earned_increased_count}
/${stayer_leaver_assessments_spm4_spm.count}
-
- Format: Percent
- Decimals: 2
Metric 4.2 – Change in non-employment cash income for adult system stayers
Metric 4.5 – Change in non-employment cash income for adult system leavers
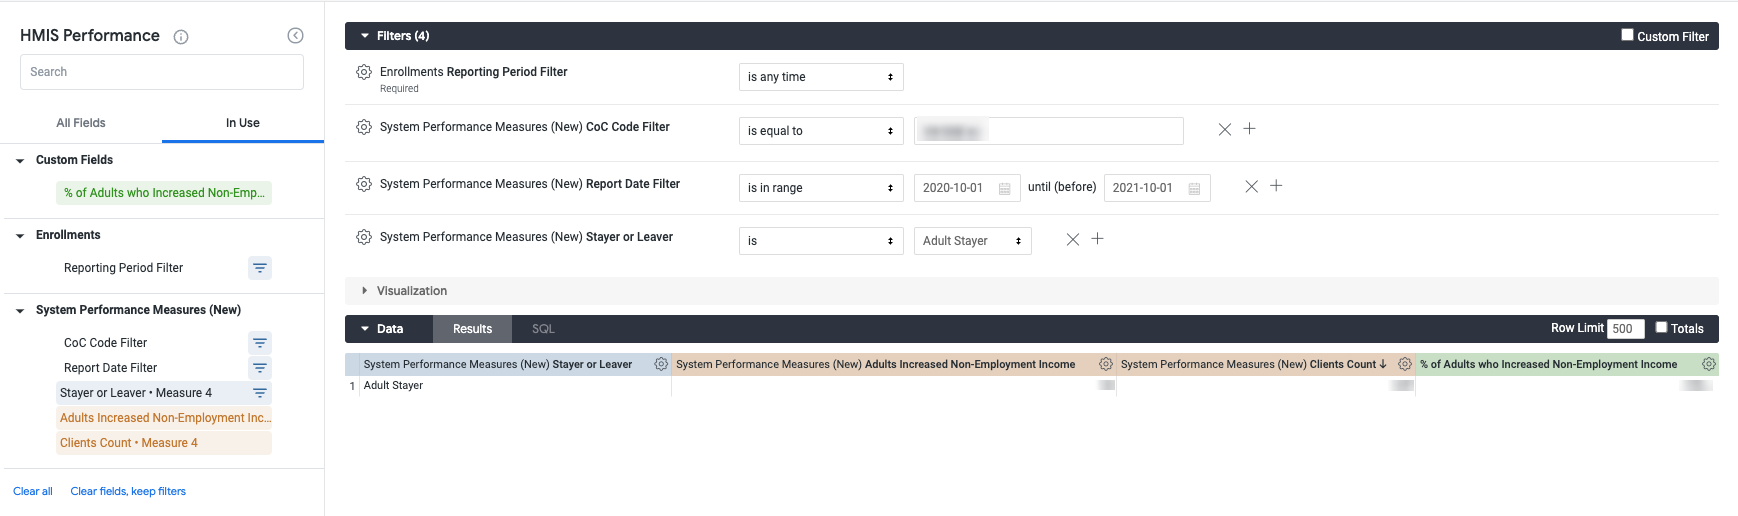
Dimensions
- Stayer of Leaver
Measures
- Adults Increased Non-Employment Income
- Clients Count
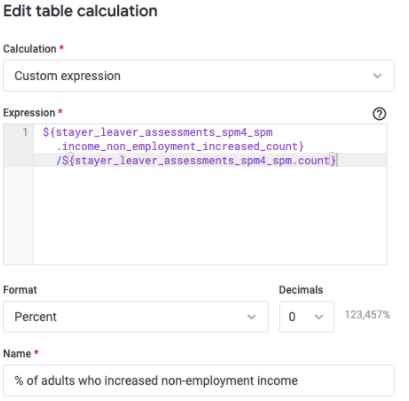
Custom Field
- Table Calculation: Percentage of Adults who Increased Non-Employment Income
- ${stayer_leaver_assessments_spm4_spm.income_non_employment_increased_count}
/${stayer_leaver_assessments_spm4_spm.count}
-
- Format: Percent
- Decimals: 2
Metric 4.3 – Change in total income for adult system stayers
Metric 4.6 – Change in total income for adult system leavers
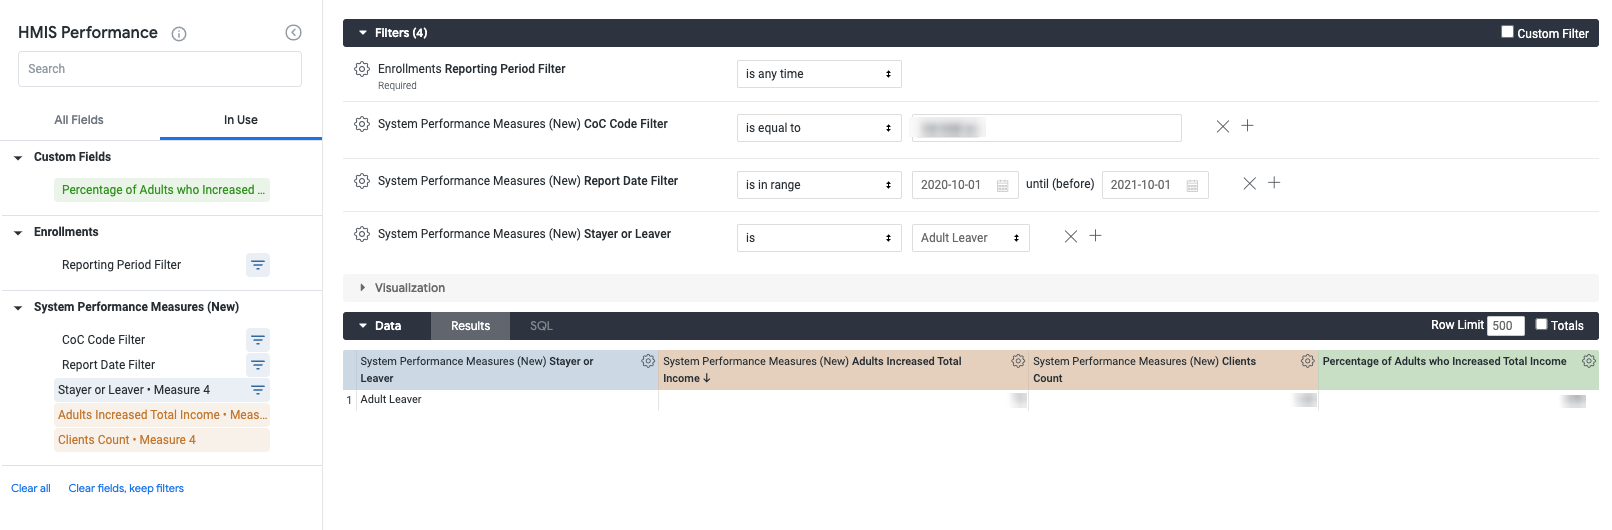 Dimensions
- Stayer of Leaver
Measures
- Adults Increased Total Income
- Clients Count
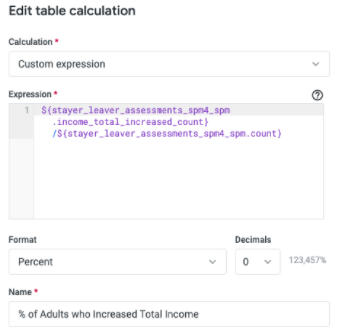
Custom Field
- Table Calculation: Percentage of Adults who Increased Total Income
- ${stayer_leaver_assessments_spm4_spm.income_total_increased_count}
/${stayer_leaver_assessments_spm4_spm.count}
-
- Format: Percent
- Decimals: 2
Metric 4.1 - 4.6 in One Look
Utilizing the guidance above, adding in the Stayer/Leaver dimension with all four Measure 4 Measures and the table calculations will create a single table with all six metrics in one convenient Look.

Further Analysis
Further analysis can be done utilizing additional dimensions and measures within Looker.
Measure 4 has additional dimensions to utilize for analysis including earlier, updated and later income amounts, information dates and total. Taking advantage of additional Looker fields and filters with Measure 4 dimensions and measures to partake in further analysis can also be achieved by pulling in some of the following options:
- Clients - Unique Identifier
- Use Unique ID with income amount dimensions and the sort function to review income amounts.
- Common mistakes include input of annual income amounts instead of monthly amounts
- Income Sources and Amounts
- Using Entry Screen and Update Status income amounts can assist analysis of income increases for Social Security Benefits annual cost-of-living adjustments
- Agency Filter
- To analyze agency specific data for review/needed updates
- Program Type Filter
- To review a chosen program type(s)
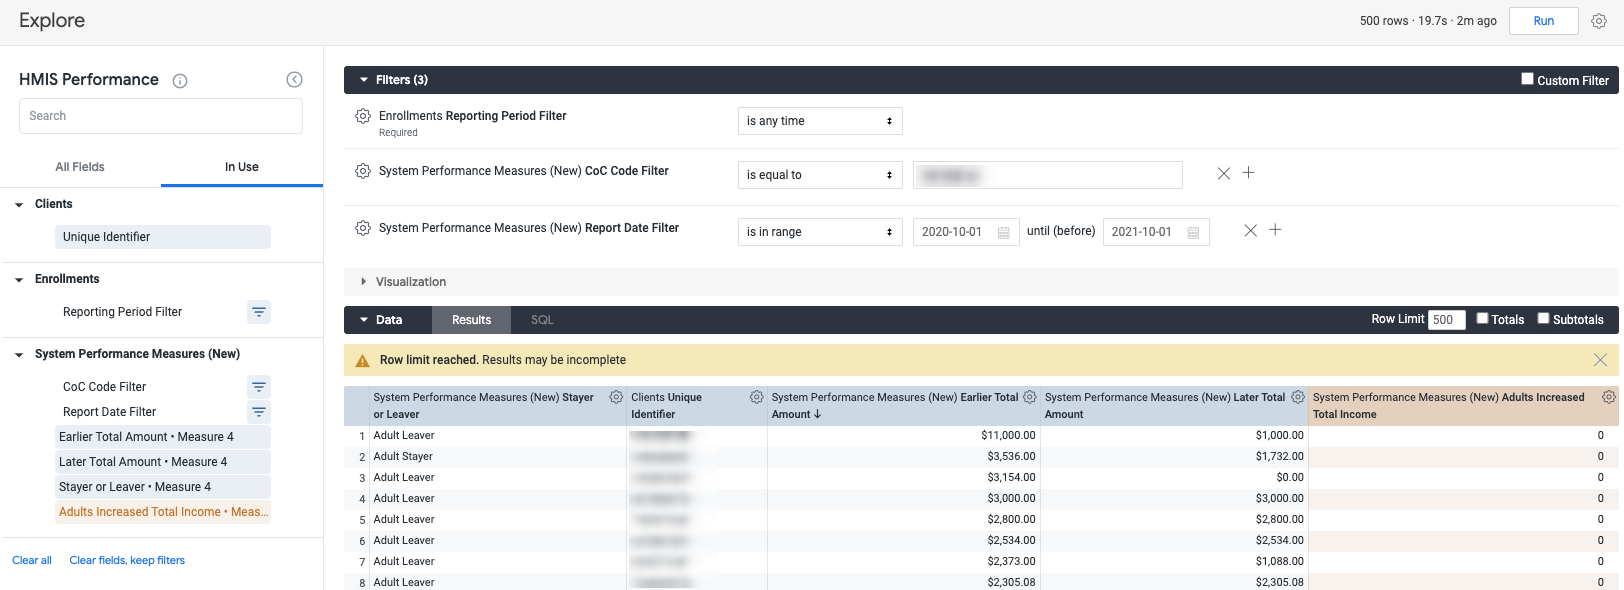
Sample Look featuring Unique ID & Sort with SPM Measure 4 dimensions and measures.