Overview of Measure 7
Successful placement from Street Outreach (SO), successful placement in Permanent Housing (PH) and retention of Permanent Housing (PH) make up the three components of Measure 7. The goal of Measure 7 is to increase rates of successful placements from SO, and increase rates of successful placement in or retention of PH.
HUD divides this Measure 7 into Measure 7a. and Measure 7b. with three total metrics.
These metrics are outlined below using guidance from HUD’s System Performance Measures Introductory Guide and HUD System Performance Measures Programming Specifications.
|
System Performance Measures Introductory Guide |
HUD System Performance Measures Programming Specifications |
|
|
Metric 7a.1: Successful Placement from Street Outreach |
||
|
“Change in placements to permanent housing destinations, temporary destinations (except for a place not meant for human habitation), and some institutional destinations.” |
“Counts leavers who exited SO during the report date range and how many of those exited to an acceptable destination.” |
|
|
Metric 7b.: Successful Placement in or Retention of Permanent Housing |
||
|
Metric 7b.1 |
“Change in exits to permanent housing destinations” |
Counts leavers who exited ES, SH, TH, PH – RRH, and PH (without moving into housing) during the report range and how many of those exited to permanent housing destinations. |
|
Metric 7b.2 |
“Change in exit to or retention of permanent housing” |
“Counts stayers and leavers with a housing move-in date in all PH projects except PH-RRH and how many of those were stayers or leavers who exited to permanent housing destinations.” |
Refer to the HUD System Performance Measures Programming Specifications for details about how the report is programmed.
Keys to Measure 7 Success
Understanding Measure 7 starts with understanding the client universes that this data is obtained from. Each metric has a different universe.
Metric 7a.1. client universe includes persons in SO project types and persons who exited from SO project types during the reporting period.
Metric 7b.1. client universe includes persons in ES, SH, TH and PH-RRH project types that exited during the reporting period.
Metric 7b.2. Client universe includes persons in all PH project types (excluding RRH) during the reporting period.
To be more straightforward, metric 7a.1. looks at street outreach clients and their exits during the reporting date range (which are hopefully to permanent housing destinations, most temporary destinations, and some institutional destinations). Metric 7b.1. looks at clients in shelter, safe haven, transitional housing and rapid re-housing and their exits during the reporting date range (which are hopefully permanent housing). Metric 7b.2 looks at clients in permanent housing during the reporting date range (except rapid re-housing because they were covered in 7b.1) and if clients in that universe either stayed in permanent housing or exited to another permanent destination.
A major key to success for this measure is a client’s exit destination. Inaccurate client exit destinations, “other” destinations, or missing/unknown destinations (Null, Client Doesn’t Know, Client Refused, Data Not Collected or No Exit Interview Completed) will impact the rate of successful placement.
To review client exit destinations, consider reviewing the [OUTS-101] Program Outcome Measures Clarity report and/or use Looker to review client exit destinations.
Using System Performance Measures in Looker: Measure 7
NOTE: The SPM fields are ONLY to be used with the filters within the SPM field (Agency Filter, Agency Status Filter, CoC Code Filter, Program Status Filter, Program Type Filter and Report Date Filter). Adding filters, dimensions and measures outside of the SPM field is not recommended or advised as it will impact the queries runability and accuracy.
To Match the Clarity SPM Report
For this measure, the data that aligns with the Clarity SPM report will be found in the Total column in the data table for the three metrics. The rows above the total can be utilized as a tool to analyze exit destination counts. Three Looks will be created for this measure, but the logic behind them is quite similar. There will be a table calculation for each look to measure the rate of successful exits or rate of retention. All steps will be outlined below. Note: Table Calculations are to be added in after the initial Look has been run.
Filters
Select your filters. The following filters are required.
- CoC Code Filter
- Report Date Filter
- System Performance Measures (New) Report Date Filter end date should reflect one day after your intended range. For example if you want your data to reflect 10/01/2020 - 09/30/2021, your report date range will be:
-png-1.png)
- Enrollments Report Period Filter will be included automatically.
- Set filter to “is any time”
Metric 7a.1 – Change in exits to permanent housing destinations, temporary destinations (except for a place not meant for human habitation), and some institutional destinations
 Dimensions
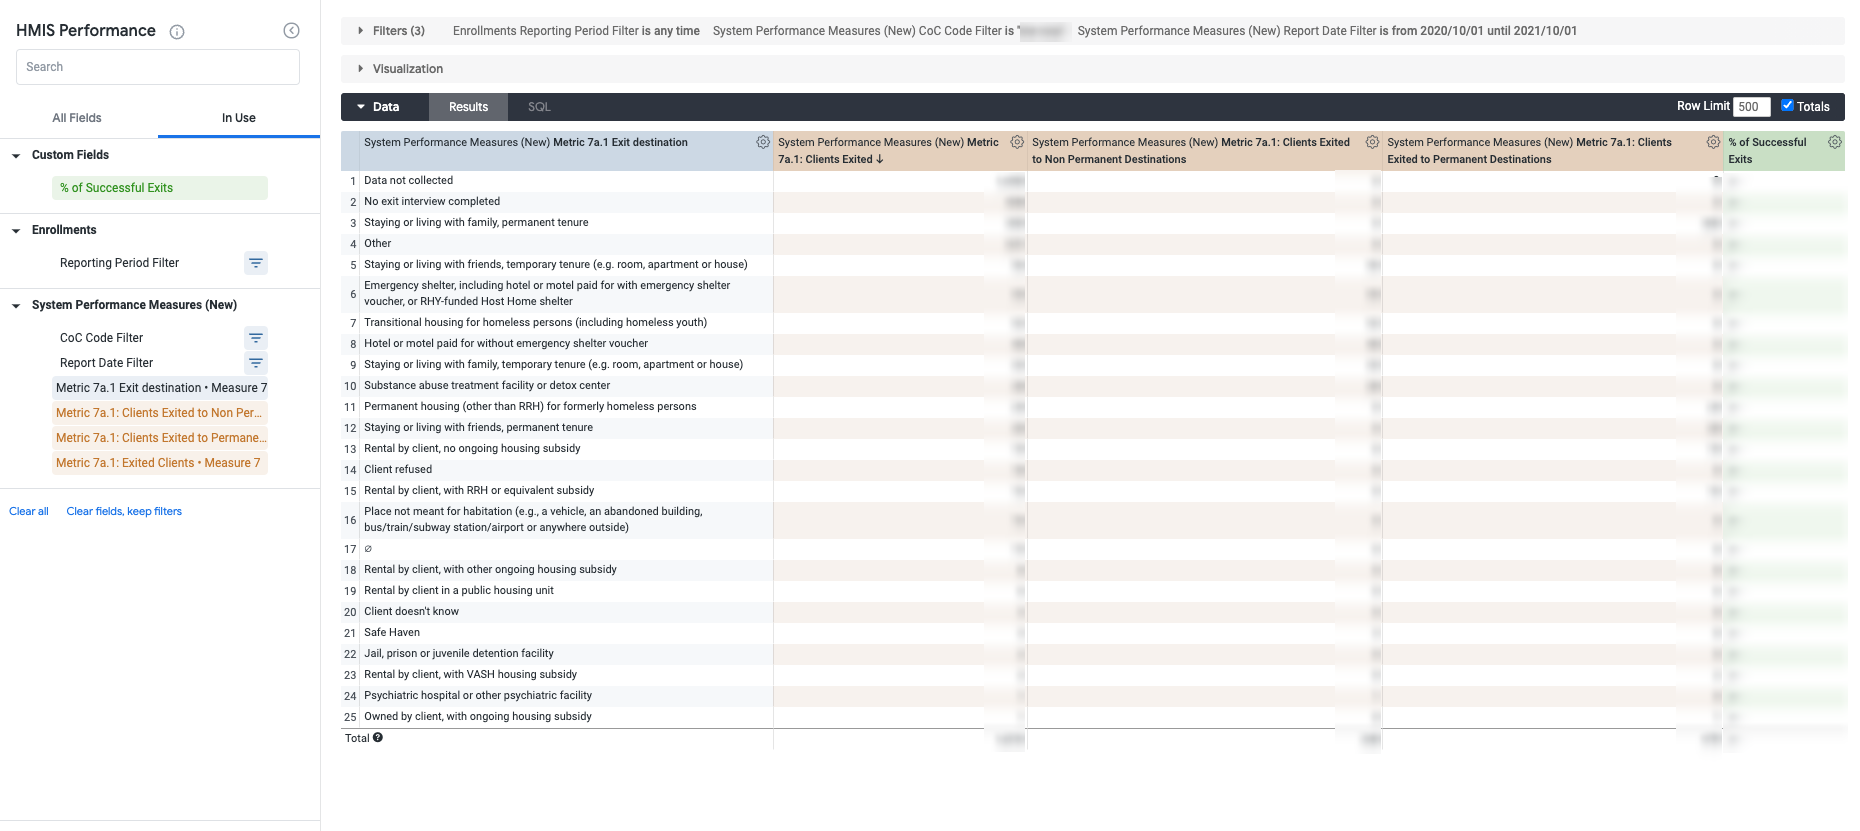
- Metric 7a.1 Exit Destination
Measures
- Metric 7a.1: Clients Exited (Universe)
- Metric 7a.1: Clients Exited to Non-Permanent Destinations
- Metric 7a.1: Clients Exited to Permanent Destinations
Custom Fields
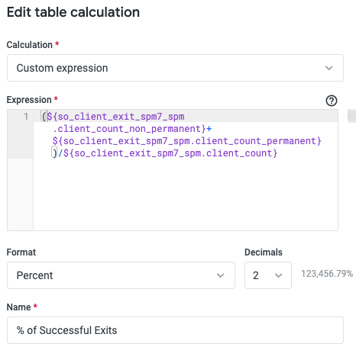
- Table Calculation: Percentage of Successful Exits
- (${so_client_exit_spm7_spm.client_count_non_permanent} +${so_client_exit_spm7_spm.client_count_permanent})
/${so_client_exit_spm7_spm.client_count}
-
- Format: Percent
- Decimals: 2
Additional Steps
Select “Totals” next to Row Limit in the Data header.

Metric 7b.1 – Change in exits to permanent housing destinations
Dimensions
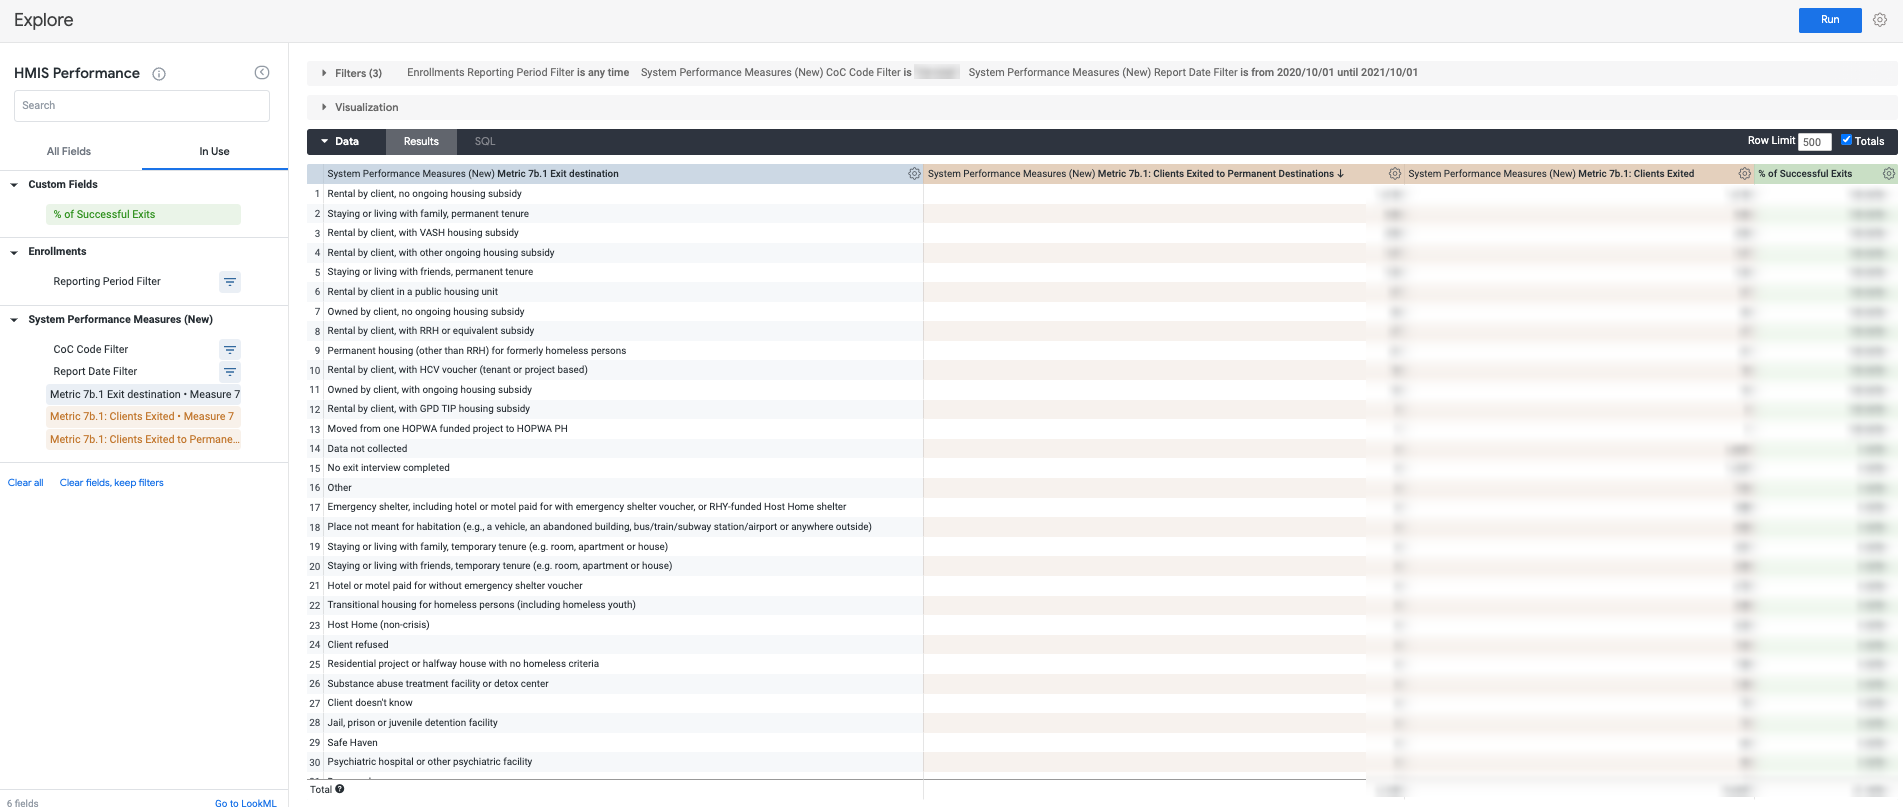
- Metric 7b.1 Exit Destination
Measures
- Metric 7b.1: Clients Exited (Universe)
- Metric 7b.1: Clients Exited to Permanent Destinations
Custom Fields
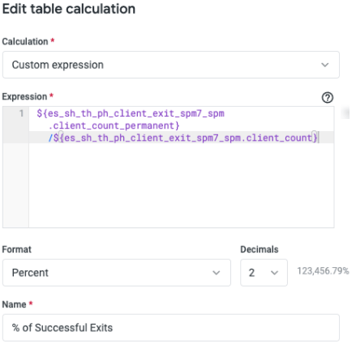
- Table Calculation: Percentage of Successful Exits
- ${es_sh_th_ph_client_exit_spm7_spm.client_count_permanent}
/${es_sh_th_ph_client_exit_spm7_spm.client_count}
-
- Format: Percent
- Decimals: 2
Additional Steps
Select “Totals” next to Row Limit in the Data header.
Metric 7b.2 – Change in exit to or retention of permanent housing
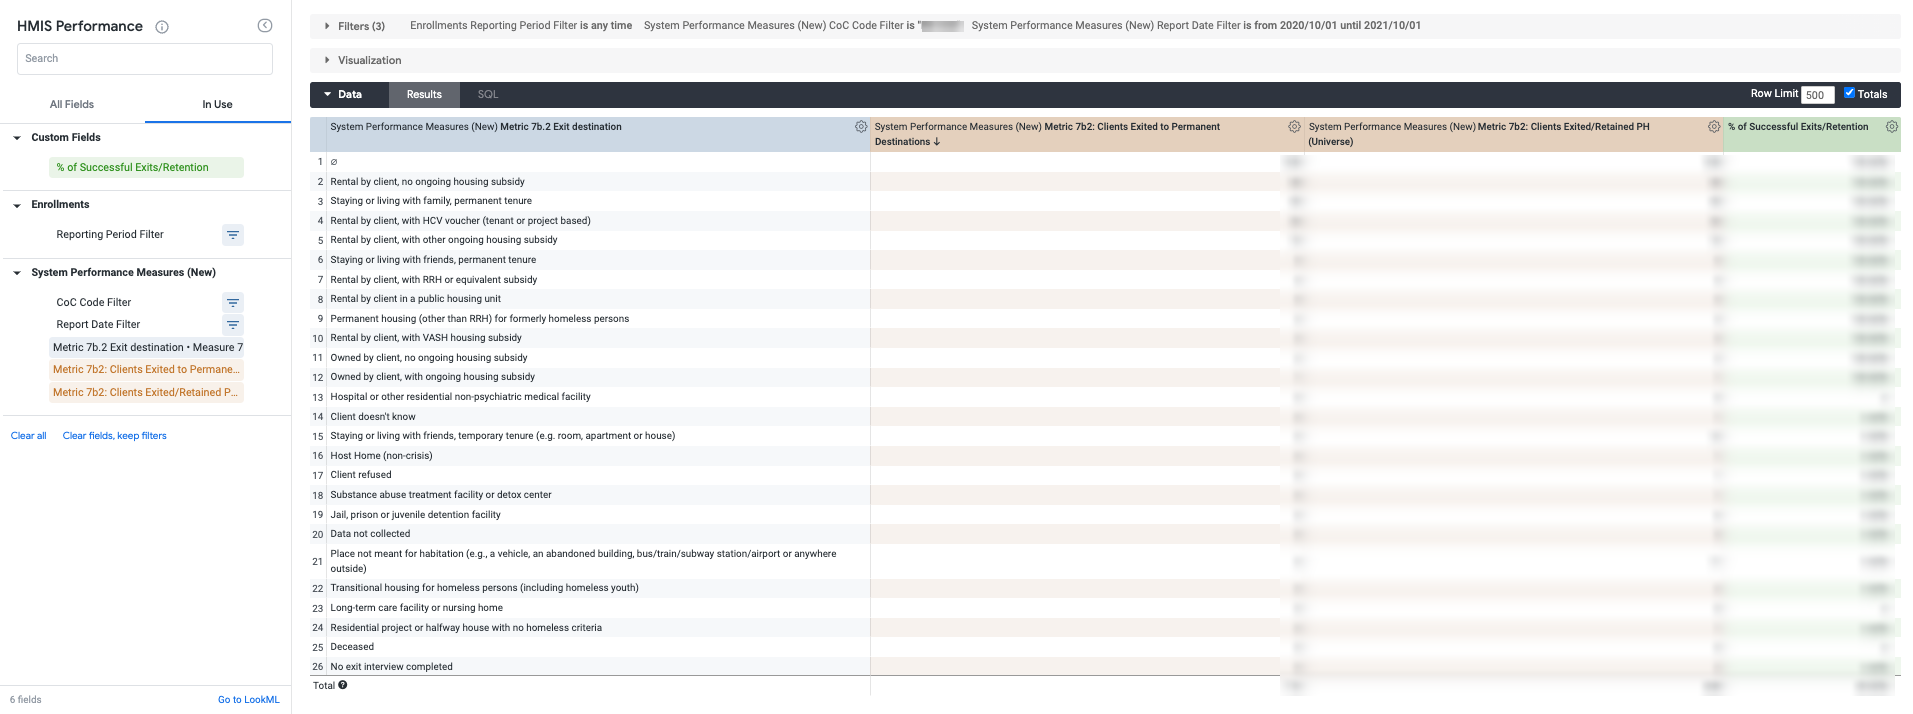 Dimensions
- Metric 7b.2 Exit Destination
Measures
- Metric 7b.2: Clients Exited to Permanent Destinations
- Metric 7b.2: Clients Exited/Retained PH (Universe)
Custom Fields
- Table Calculation: Percentage of Successful Exits
- ${ph_stayer_leaver_client_spm7_spm.client_count_permanent}
/${ph_stayer_leaver_client_spm7_spm.client_count}
-
- Format: Percent
- Decimals: 2
Additional Steps
Select “Totals” next to Row Limit in the Data header.
Further Analysis
Further analysis can be done utilizing additional dimensions and measures within Looker.
Measure 7 has additional dimensions to utilize for analysis (enrollment IDs for each metric). Taking advantage of additional Looker fields and filters with Measure 7 dimensions and measures to partake in further analysis can also be achieved by pulling in some of the following options:
- Clients - Unique Identifier
- To identify clients that may be in need of additional review
- Clients - Demographics
- Pivot with Client - Dimensions like Gender, Race, Ethnicity, Age Tier, etc.
- Program Type Filter
- Use with Metric 7b.1 fields for program type evaluation
- Agency Filter
- Use to further analyze exit destinations/outcomes per agency
- Note: Agency selection must be applicable to the selected metric’s client universe
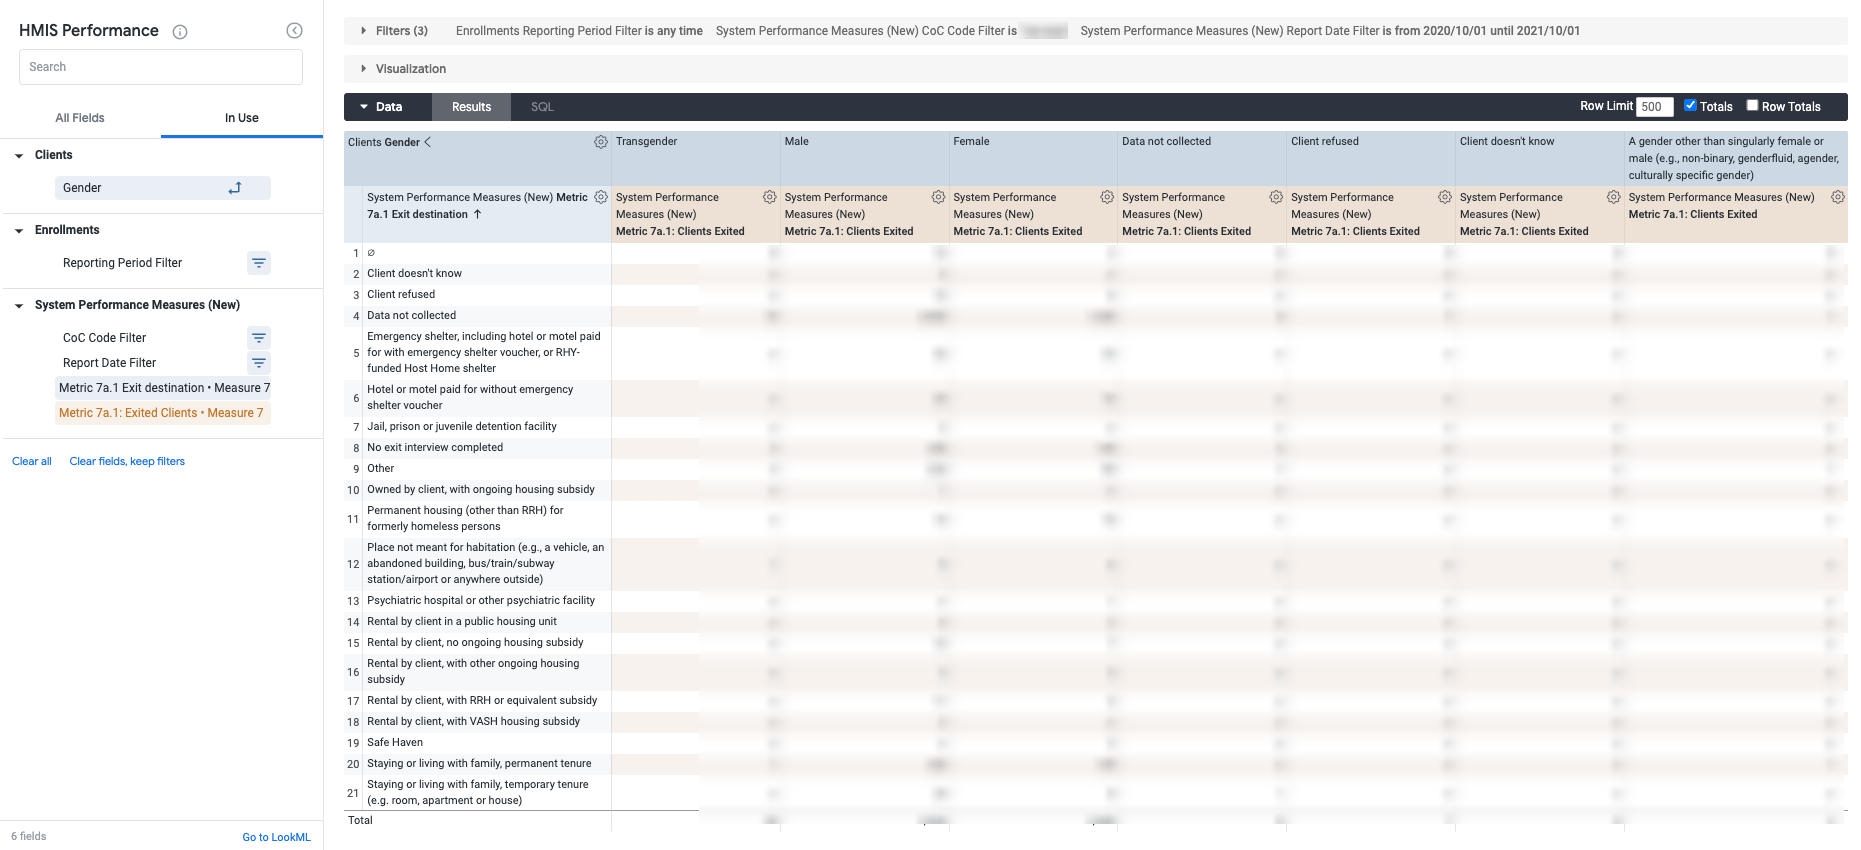
Sample Look featuring Metric 7a.1 Exit Destination, Metric 7a.1 Clients Exited and a pivot by Clients-Gender.