Retiring Soon - Updated Data Quality LookML Dashboard Coming Soon
This dashboard gives the user easy access to HUD HMIS data quality problems. The drill downs allows a user to directly access the screen that needs attention. The intended user is a case manager, intake worker, or program manager.
Overview
- Data analysis model
- Data Quality
- Potential Exits uses the Client Model
- Tiles
- UDE (Universal Data Element) Error Counts
- Profile Screen
- Enrollment Screens
- Living Situation Elements (3.917)
- Program Specific
- Common Elements
- Program Specific Federal Partner Elements
- Annual Assessment Status
- Coordinated Entry Errors
- Current Living Situation
- Potential Exits
- UDE (Universal Data Element) Error Counts
- Available user filters
- Program CoC
- Results from Programs serving selected CoCs
- Agency
- Include selected Agencies
- Programs/Projects
- Include selected Programs/Projects
- Date Range
- UDE and Program Specific
- Default is the past 1 complete month
- Annual Assessment Status
- Default is the past 12 complete months
- UDE and Program Specific
- Assigned Staff
- Include selected currently assigned staff
- Potential Exits Cutoff Date
- Default is last activity was more than 180 days ago
- Program CoC
Tiles Overview
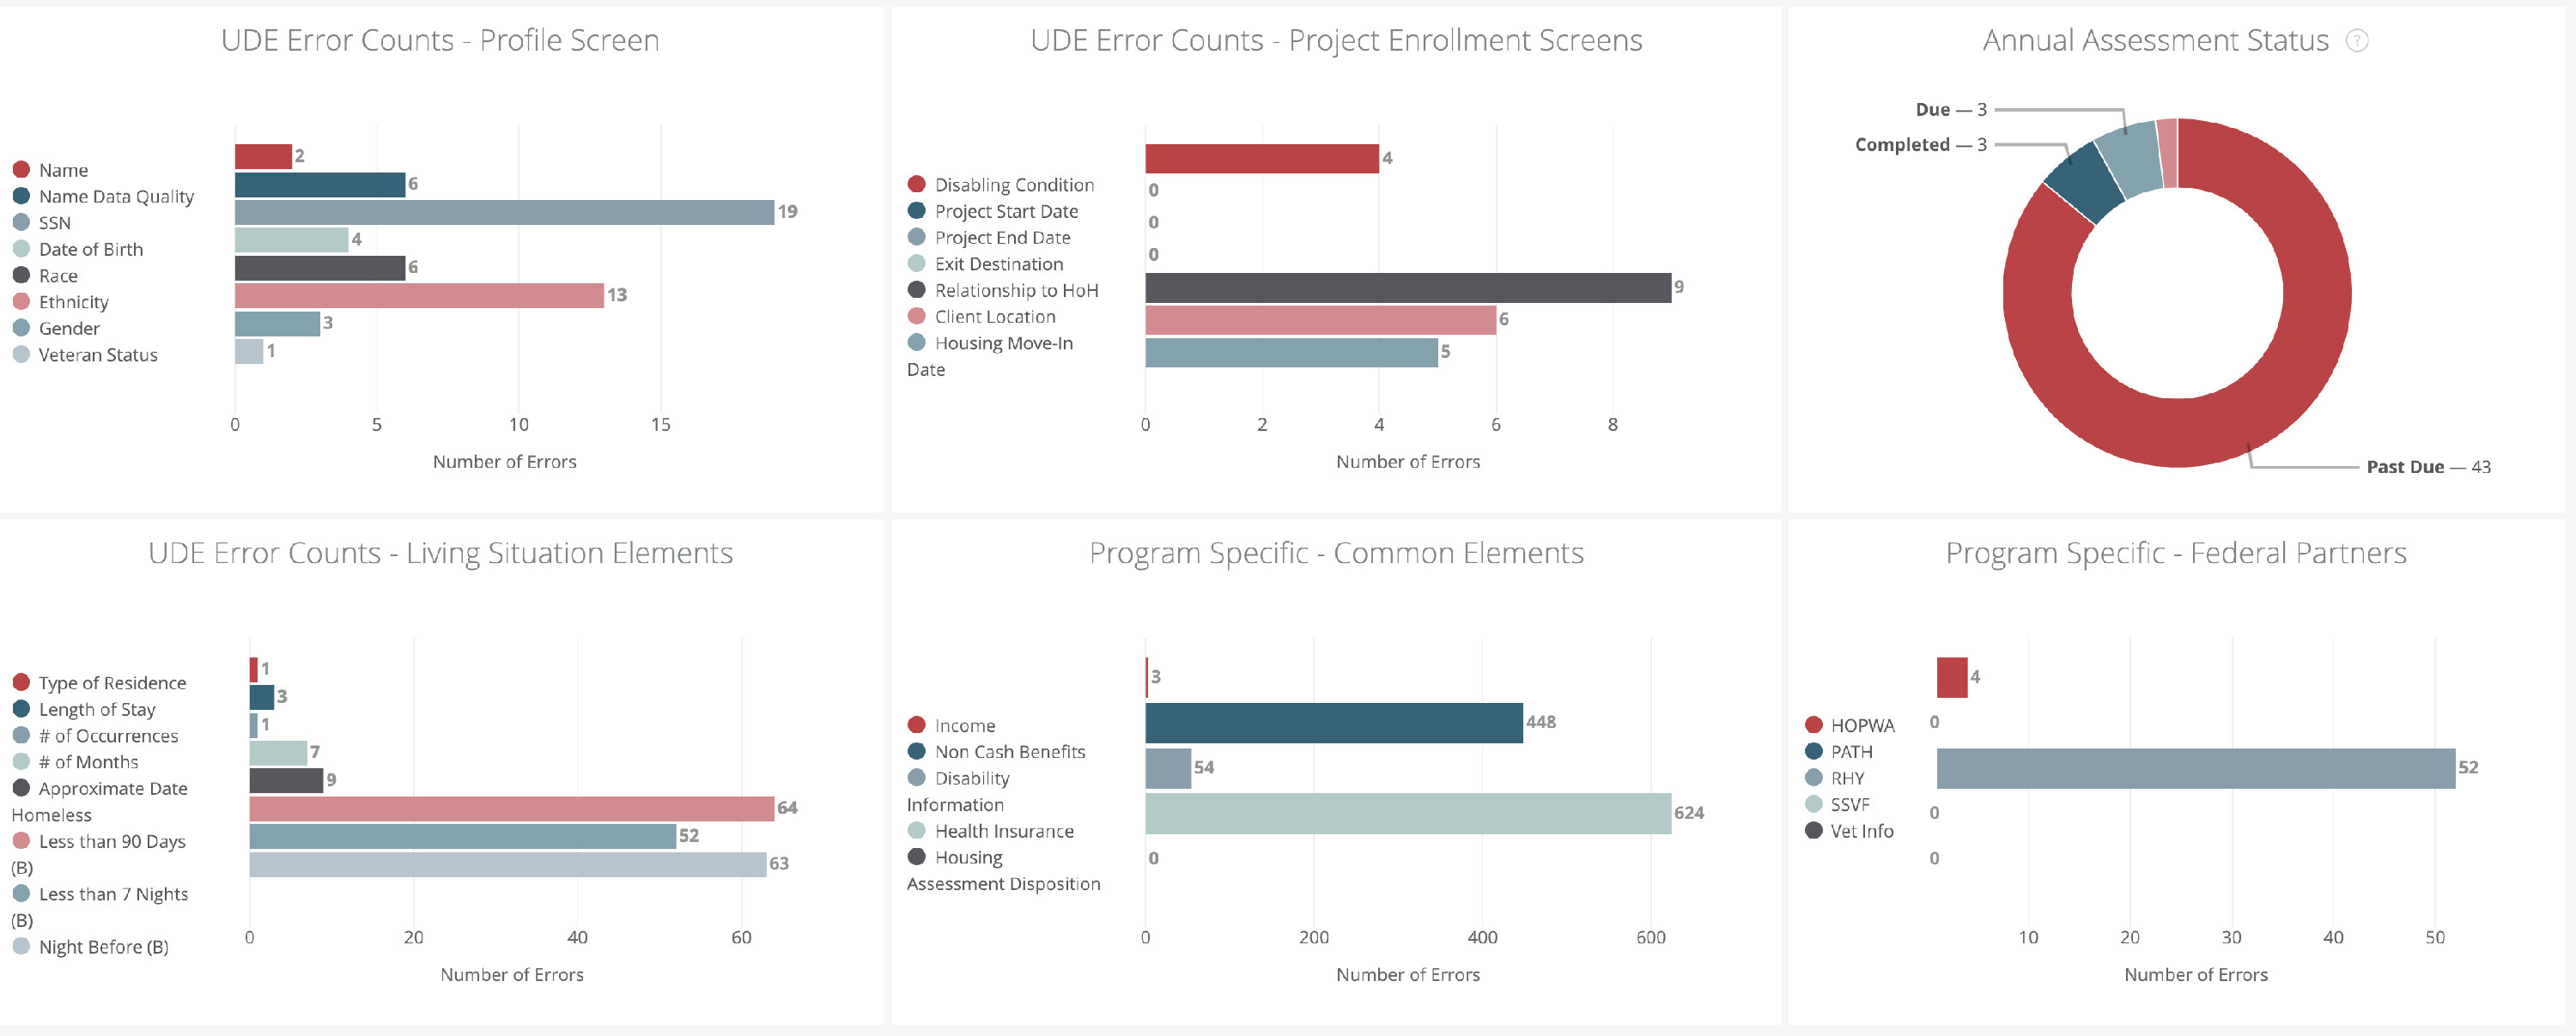
UDE Error Counts - Profile Screen
Includes the following measures from the Data Quality data analysis model:
- DQ Client UDE
- Name Error Count
- Name Data Quality Error Count
- SSN Error Count
- DoB Error Count
- Race Error Count
- Ethnicity Error Count
- Gender Error Count
- Veteran Status Error Count
The only filtering applied by default on this tile is the Reporting Period Filter: "Is in the past 1 complete months".
UDE Error Counts - Project Enrollment Screens
Includes the following measures from the Data Quality data analysis model:
- DQ Client UDE
- Disabling Condition Error Count
- Project Start Date Error Count
- Project End Date Error Count
- Exit Destination Error Count
- Relationship to HoH Error Count
- Client Location Error Count
- Housing Move-in Date Error Count
The only filtering applied by default on this tile is the Reporting Period Filter: "Is in the past 1 complete months".
UDE Error Counts - Living Situation Elements
Includes the following Table Calculations from the Data Quality data analysis model:
All fields are found in DQ Client UDE view.
- Living Situation A Error Counts
- Length of Stay at Prior Place A Error Counts
- Number of Occurrences A
- Number of Months A
- Approximate Date Homeless A
- Living Situation B Error Counts
- Length of Stay at Prior Place B Error Counts
- Number of Occurrences B
- Number of Months B
- Approximate Date Homeless B
- Less than 90 Days (B)
- Did you stay less than 90 days B Error Count
- Less than 7 Nights (B)
- Less than 7 Nights B
- Night Before (B)
- Night Before on Streets
The only filtering applied by default on this tile is the Reporting Period Filter: "Is in the past 1 complete months".
Program Specific - Common Elements
Includes the following measures from the Data Quality data analysis model:
- Aggregates
- Total Income Errors Count
- Total Non Cash Benefits Income Errors Counts
- Total Disability Information Errors Count
- Total Health Insurance Count
- Housing Assessment Disposition Error Count
The only filtering applied by default on this tile is the Reporting Period Filter: "Is in the past 1 complete months".
Program Specific - Federal Partners
Includes the following measures from the Data Quality data analysis model:
- Aggregates
- Total HOPWA Error Count
- Total PATH Error Count
- Total RHY Error Count
- Total SSVF Error Count
- Total Veteran Information Errors Count
The only filtering applied by default on this tile is the Reporting Period Filter: "Is in the past 1 complete months".
Annual Assessment Status
Includes the following fields from the Data Quality data analysis model:
- DQ Annual Assessments
- Annual Assessment Status dimension
- Enrollments
- Count
The following are set as default filtering:
- DQ Annual Assessments, Annual Assessment Status: matches (advanced): Completed, Completed out of range, Due in 30-60 days, Past Due, Due
- Program Funding Sources, Funding Source: matched (advanced):
- HUD: CoC - Joint Component TH/RRH,
- HUD:CoC – Homelessness Prevention (High Performing Comm. Only),
- HUD:CoC – Permanent Supportive Housing,
- HUD:CoC – Rapid Re-Housing,
- HUD:CoC – Transitional Housing,
- HUD: ESG - CV,HUD:ESG – Emergency Shelter (operating and/or essential services),
- HUD:ESG – Homelessness Prevention,
- HUD:ESG – Rapid Rehousing,
- HUD:ESG – Street Outreach,
- HUD:HOPWA – Permanent Housing (facility based or TBRA),
- HUD:HOPWA – Short-Term Rent, Mortgage, Utility assistance,
- HUD:HOPWA – Permanent Housing Placement,
- HUD:HUD/VASH,
- HHS:PATH – Street Outreach & Supportive Services Only,
- HHS:RHY – Maternity Group Home for Pregnant and Parenting Youth,
- HHS:RHY – Transitional Living Program,
- VA:Supportive Services for Veteran Families,
- VA:Grant Per Diem - Case Management/Housing Retention,
- VA:Grant Per Diem – Service Intensive Transitional Housing,
- VA:Grant Per Diem – Transition in Place,
- VA: CRS Contract Residential Services,
- VA: Community Contract Safe Haven,
- HUD: Pay for Success,
- HUD: Rural Housing Stability Assistance Program,
- HHS: RHY – Demonstration Project
- Programs, Tracking Method: is not equal to: Night-by-Night
Coordinated Entry Errors
Includes the following field from the Data Quality data analysis model:
- Living Situation Verified By Error Count (DQ Coordinated Entry)
The only filtering applied by default on this tile is the Reporting Period Filter: "Is in the past 1 complete months".
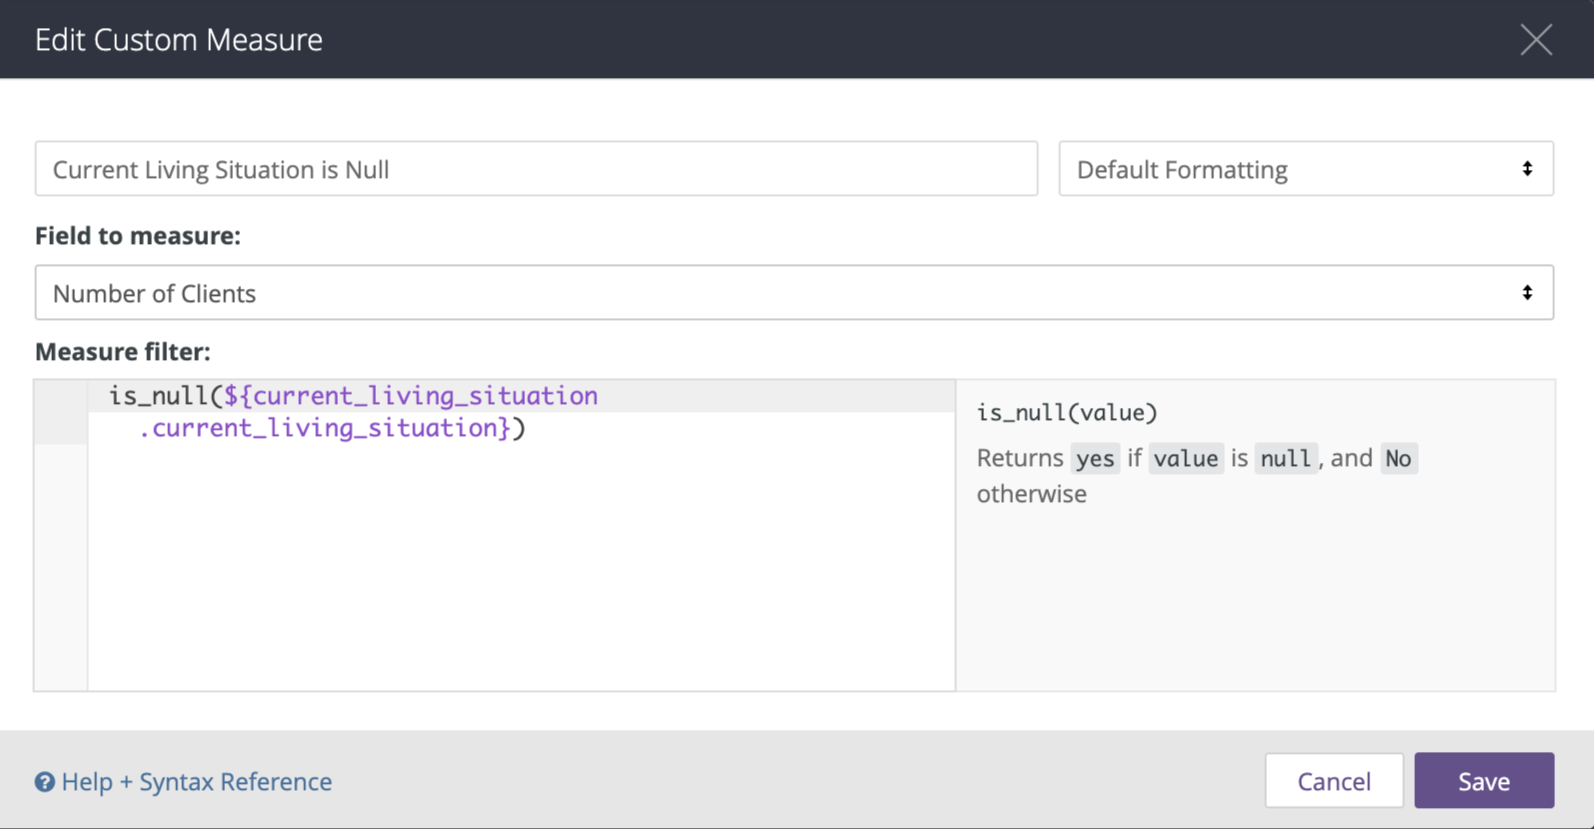
Current Living Situation
Includes the following field from the Data Quality data analysis model:
- Custom Measure: Current Living Situation is Null
- Field to measure: Number of Clients
- Measure Filter:
is_null(${current_living_situation.current_living_situation})
Filters
- Reporting Period Filter, Enrollments - Default: is in the past 1 complete months
- Head of Household (Yes/No), Enrollments - is Yes
- Funding Source, Program Funding Sources:
- HUD:ESG – Street Outreach
- HUD:ESG – Emergency Shelter (operating and/or essential services)
- HUD:CoC – Supportive Services Only
- HHS:RHY – Street Outreach Project
- HHS:PATH – Street Outreach & Supportive Services Only
- Custom Filter:
(${dq_project_descriptor.project_type_code}="Emergency Shelter" AND
${dq_project_descriptor.tracking_method}="Night-by-Night") OR
${dq_project_descriptor.project_type_code}="Coordinated Entry" OR
${dq_project_descriptor.project_type_code}="Services Only" OR
${dq_project_descriptor.project_type_code}="Street Outreach"
For more information about the Data Quality data analysis model, refer to the Data Quality Model help center article.
Potential Exits - Top 25
Includes the following fields from the Client Model:
- Programs, Full Name
- Enrollments, Enrollment ID - includes a link to either the Client's Profile Screen or the Enrollment Entry Screen
- Enrollments, Project Start Date
- Client Interactions, Last Interaction Type
- Client Interactions, Last Interaction Date - Sorted in ascending order
The following filters are included by default:
- Clients, Deleted: is No
- Enrollment, Active in Project: is equal to Yes
- Enrollments, Enrollment ID: is not null
- Enrollments, Project Start Date: is on or after 2012-10-01
- Custom Filter:
${client_last_interaction.ref_agency}=${programs.agency_id}
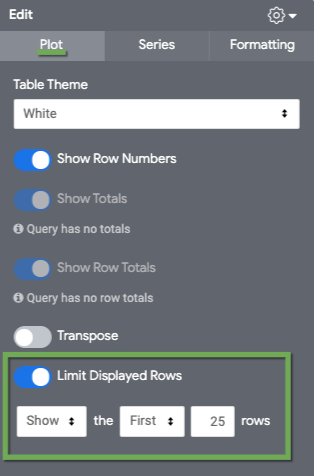
The visualization is a simple table, but it is limited to display the Top 25 longest inactive.
Access
Clarity Human Services Data Analysis Access
For users with Clarity Human Services Access Roles with Data Analysis:
- Navigate
 to Reports,
 - then Data Analysis,
- then Built-in Reports
- Run Data Quality Dashboard
If the Data Quality Dashboard is not available, contact your system administrator.
System administrators, for information on including dashboards in your embedded Data Analysis, refer to Looker - Clarity Human Services Integration.
A built-in dashboard may also be set as a user's home screen. For instructions on this feature see Data Analysis Embedded Dashboards.
Standalone Looker
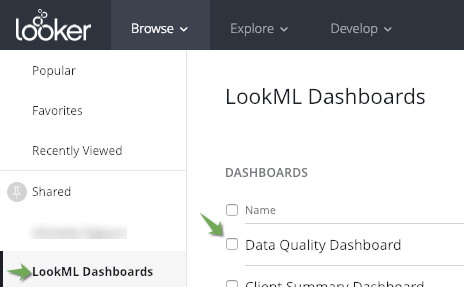
From the Browse tab:
- LookML Dashboards
- Choose Data Quality Dashboard from the list of available dashboards
- If you have access to more than one Clarity instance and Looker connection model, be sure to select the dashboard for the correct connection model
Updated: 04/14/2023