
Table of Contents
- Overview
- Access
- Location
- Report Library
- Explore
- Data Analysis
- Configuration and Additional Resources
Overview
The Reports module brings reporting into the new Clarity interface. You can find, run, schedule, and build reports without switching to the legacy interface.
The module has three areas: Report Library, Explore, and Data Analysis. This article explains what each area does, who can use it, and how the areas work together.
Access
Each area appears only if your Access Role includes the matching access right. Areas you don't have permission to access don't appear in the menu.
|
Area |
What You Can Do |
Access Needed |
|
Report Library |
Find, run, and schedule Bitfocus-maintained reports. |
Report Library access right. |
|
Explore |
Build ad hoc reports from a data model and save them as Looks. |
Data Analysis must be enabled for the instance. Data Analysis access right. Saving a Look also requires the Data Analysis Save access right. |
|
Data Analysis |
Browse and run built-in and custom reports, including Looks you save from Explore. |
Data Analysis must be enabled for the instance. Data Analysis access right. |
Note: The access rights above are for the basic permissions needed to access the Reports module and the Report Library, Explore, and Data Analysis workspaces. Additional configuration enables the available reports, Looks, and LookML Dashboards. Additional access rights may be needed, as well. Full details can be found in the standalone articles for each workspace.
Location
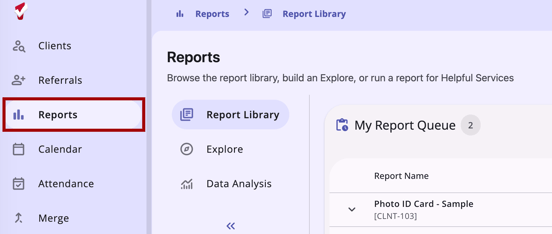
Select Reports in the primary navigation menu to open the Reports module. If you have access to the Report Library, it is selected by default.
Report Library
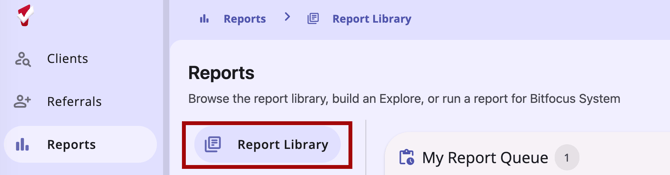
Use the Report Library to find, run, and schedule Bitfocus-maintained reports from a single searchable table. The Report Library includes the Available Reports, My Report Queue, and Favorites sections.
Finding and Running a Report
- Search: Enter a report name, report code, or category.
- Filter: Narrow the table by Category or Last Run.
- Run: Select Run on a report row to open its parameter page. Enter your parameters, then select Submit.
- Schedule: To run a report on a future date, select Schedule Report from the report row's Action menu, then choose a Scheduled Process Date.
Saving Favorites
Select the Favorite (star) icon on a report row to add the report to the Favorites card. Favoriting a report saves its last-run parameters for your current agency. The system fills them in the next time you run the report from the Favorites card.
Tracking Report Runs
My Report Queue shows your scheduled, in-process, and completed report runs from the last 60 days. Each run includes the parameters you used. From the queue, you can open a ready report, run it again with the same parameters, or delete the run.
The report status indicator in the header shows a count of your ready reports from both the Report Library and client-level reports. Select it to open or delete your runs from any page.
Explore
Use Explore to build ad hoc reports from your community's data and save them as Looks.

Choosing a Data Model
Select Explore in the Reports module to see the data models available to your community. The possible models are:
The models you see depend on what your community and agency can access or have configured.
Select a model name to open Explore for that model. Field selection, filters, pivots, and table calculations are all handled within the embedded view.
Building and Saving a Look
Once you run a query in the embedded Explore view, the Save action becomes available if your Access Role includes the Data Analysis Save access right.
To save a Look:
- Select Save.
- Select New Look, or select an existing Look to overwrite.
- Enter a Name.
- Select Save.
Once saved, the Look appears in the Data Analysis workspace.
Note: The Save action is hidden, not just disabled, for users without the Data Analysis Save access right.
Data Analysis
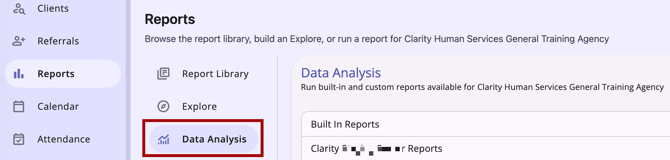
Use Data Analysis to browse and run pre-built reports organized by category. Looks saved from Explore appear here.
Browsing Report Categories
Reports are grouped into three collapsible categories:
- Built In Reports
- [Instance Name] Reports, where [Instance Name] is your community's name
- [Agency Name] Reports, where [Agency Name] is your agency's name
Each category shows how many reports it contains. Select a category with one or more reports to expand it. Opening a different category collapses the one you had open, so only one category is expanded at a time.
Running a Data Analysis Report
Select Run on a report to open it as a full-page view, the same way Explore opens. When you close the report, you return to Data Analysis with your category still expanded.
If a Report Isn't Available
- If the report list can't load, an inline error message displays with a Try Again action. The search field stays visible but disabled until the list loads successfully.
- If a specific report is inactive, deactivated, or you no longer have permission to run it, you see a "This report is no longer available" message.
Configuration and Additional Resources
- Rights Glossary for Access Roles
- System Advanced Options: Report Library
- Embedded Looker: Looker - Clarity Human Services Integration
- Looker Data Models - Overview
Published: 10/13/2026