HTML tags can be used in dashboards to include logos or provide links to other content such as other dashboards.
Images and Logos
To add an image to a dashboard, add a tile to the dashboard.
- Legacy Dashboard:
-
- Click on Text to create a new text tile
- Give the text box a title, if desired
- Enter the HTML tags
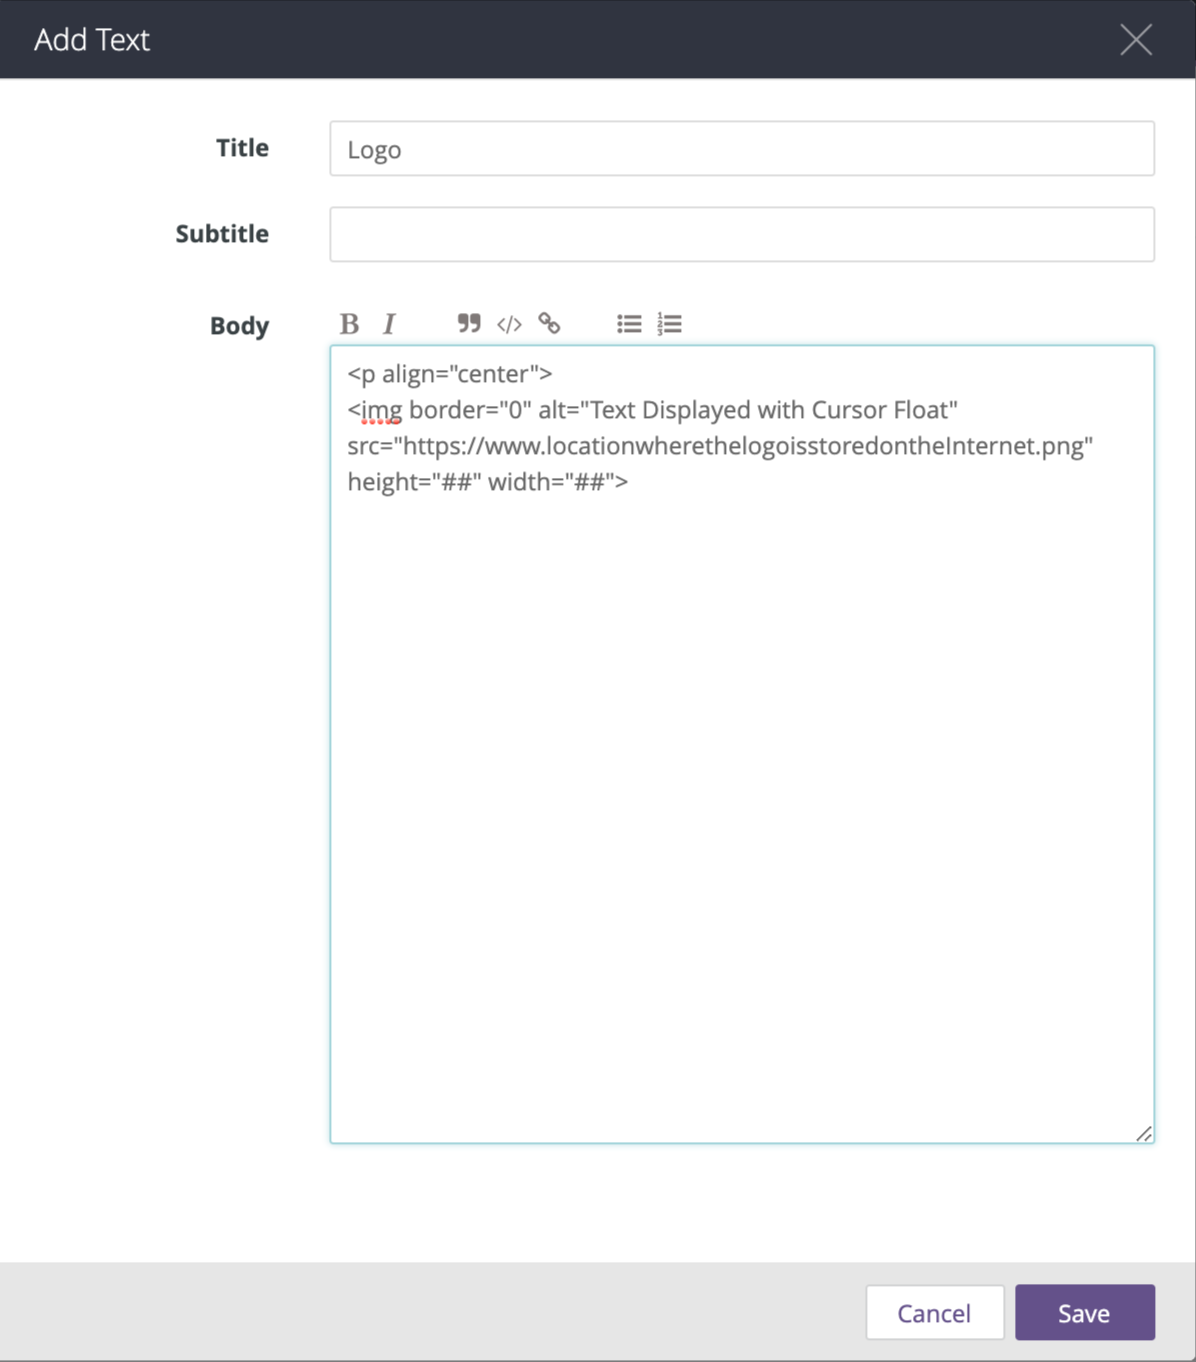
- Be sure to locate the image on the internet where the location will be stable, else the link will break and the image will not display
- Adjust HTML tags as needed
- Save
- Click on Text to create a new text tile
-
- Beta Dashboard
-
- Click on Add Tile to create a new text tile
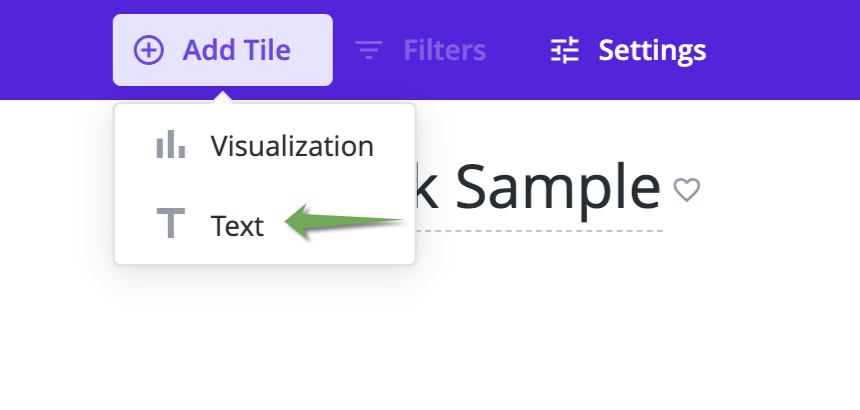
- The rest of the process is the same as legacy dashboards
- Click on Add Tile to create a new text tile
-
Links
The text tiles can also be used to link other web pages, including dashboards. Simply add
Multi-Page Dashboard Sets
Using images &/or links, dashboards can have the illusion of being a multi-page set of dashboards. The reality is separate dashboards that are merely linked together.
Below is an example of how to assemble a multi-page dashboard project using the illusion of tabs to connect the dashboards.
"Tabbed" Dashboard Set
This example uses Beta version dashboards.
- Create each dashboard to be included in the set
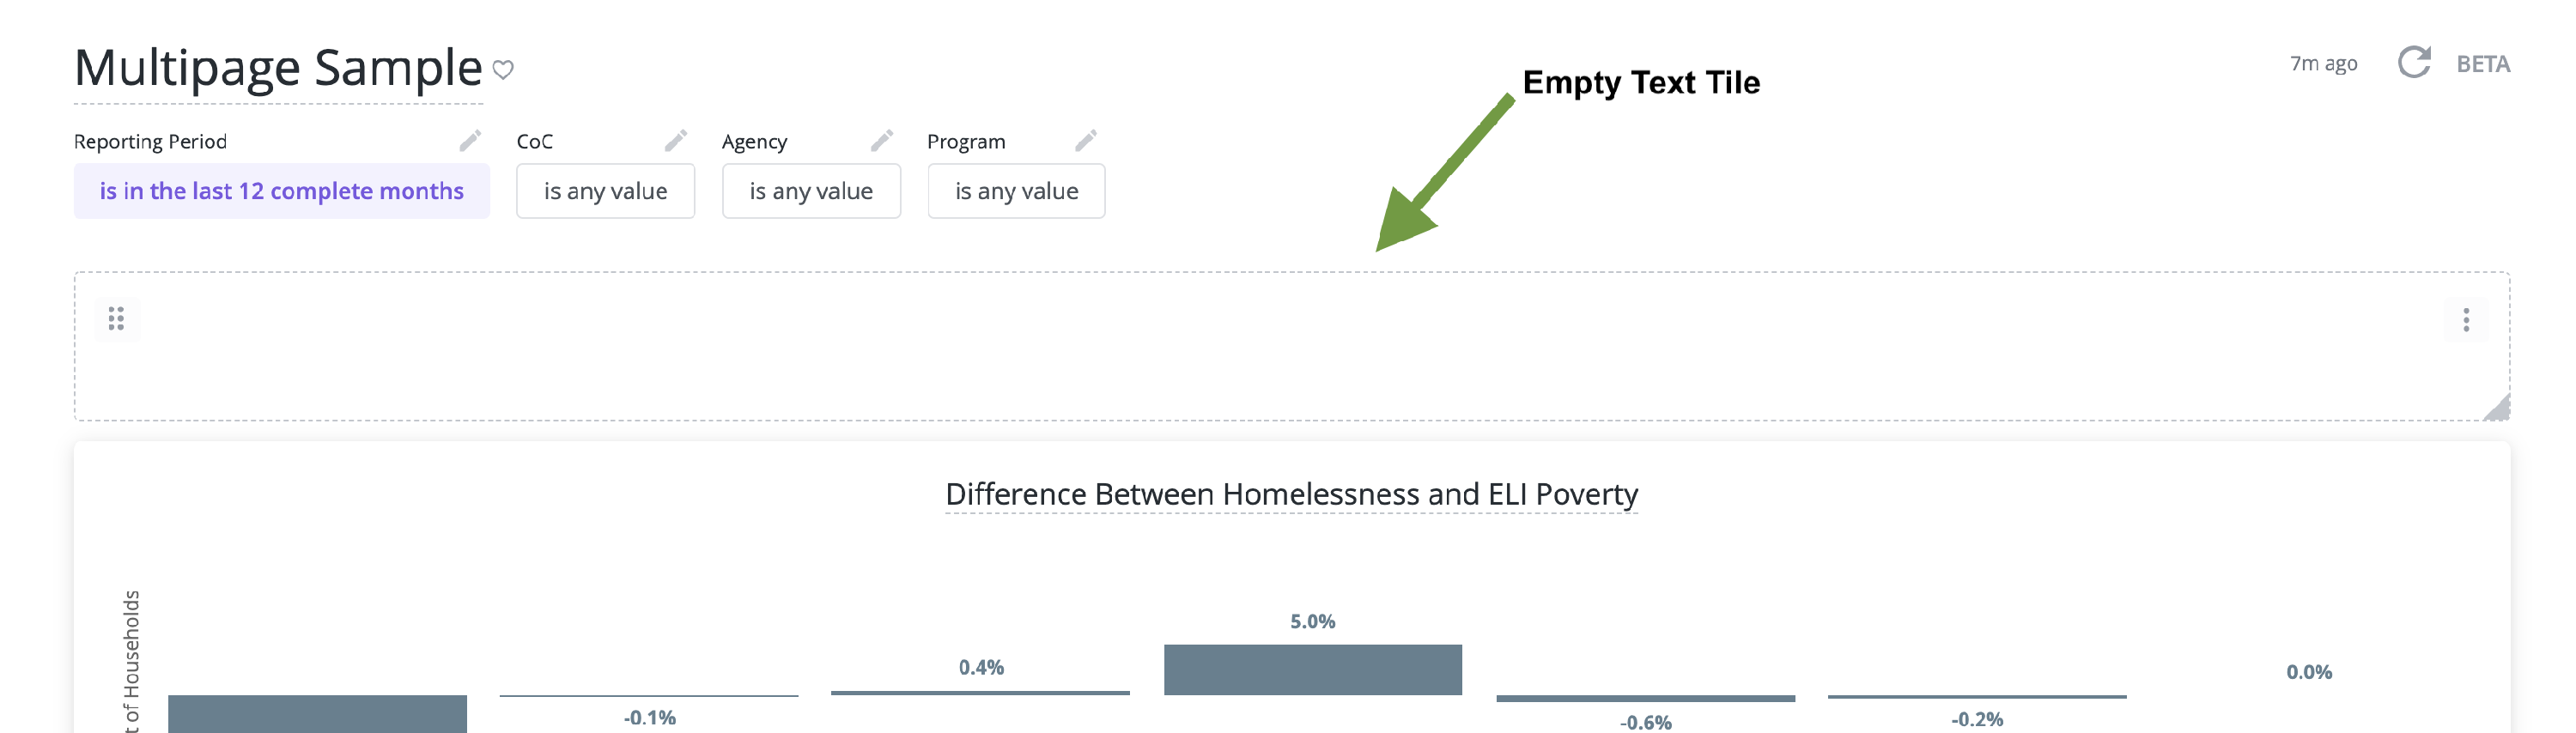
- Add a text tile at the top of each dashboard that runs across the top of the dashboard with the minimum height allowed for the tile
- Have the links to each dashboard available
- Using Markdown language, enter the names of the tabs and the links into a "table" in the empty text tile
- Repeat for each dashboard
Here is the sample markdown language used for this sample:
- ## - Displays the text as Header 2 style
- | - divides the "table" cells
- [ ] - encloses the name of the tab for each dashboard
- ( ) - encloses the link to the dashboard
The result should look something like this:
Resources
Looker has additional information on Using Markdown Language in Text Tiles.