Video Resources
Click through for a hands-on experience:
Overview
Users can import and view unsheltered Point-in-Time (PIT) data collected using Esri’s ArcGIS/Survey 123 Point-in-Time Count Solution. The unsheltered Point-in-Time integration includes:
- Additional access rights
- Additional field types
- Two navigation menus
- Map layer capabilities
- Survey Field Lists
- Individual and Household Survey Fields (linked Excel file)
The ability to import and view your CoC’s unsheltered Point-in-Time Count data takes place in the new Clarity interface. Imported data can also be enabled as a map layer to view survey locations in Outreach and other maps in Clarity.

Access Rights
The following two new access rights are available for use:
- Point-in-Time Data - View - this access right allows users access to the Unsheltered PIT tab and Counts' tabs with view access.
- Point-in-Time Data - Import - this access right allows users to import files using the Add icon
- This access right can only be enabled when Point-in-Time Data - View is enabled
- Edit and Delete rights are dependent on the Point-in-Time Data - Import access right.
Both access rights are available for Enterprise, Manager, and Admin access Role Types.

Field Types
The following two field types are now available:
- PIT Core
- PIT Custom.

The system uses a "pit_" prefix for PIT Core fields.

Users with access to create fields can create new PIT custom fields. The system uses a "c_pit_" prefix for PIT custom fields.

Counts Tab List Navigation
The Unsheltered PIT tab can be found in the primary navigation menu of the new Clarity interface. Users with the appropriate access can import and view PIT data that was collected using the ArcGIS Point-in-Time Solution.

Users can import Point in Time Data by clicking the Add button on the Counts tab.

Step 1 - The Add button opens a side sheet where the user can set import parameters and import a zipped .csv file. No other formats can be uploaded.
- In ArcGIS Online, download the solution file ‘Point-in-TimeCount_CSVExport’
- The zipped file should include two .csv files named:
- Household_Questions_0
- Individual_Questions_1
- Import parameters include:
- CoC - Picklist of CoCs in the instance
- PIT Year - Picklist with only ‘2026’
- ‘Available as map layer’ - New toggle field, OFF by default
- File uploader

- When the user saves these initial details, the system will:
- Create a draft for the year/CoC or use the existing draft
- Upload the zip archive, save it to the import_files (using the Data Import Tool - DIT)
- Unzip (using the DIT)
Step 2 - Field Mapping - Users need to map the fields in their file to the fields we have in the system.
- After unzipping the files, check that columns match:
- Return fields for mapping - The system prepares a File Field List that includes all column headers from the file uploaded.
- The screen displays a list of available Point-in-Time core and custom fields and allows the user to select which file fields should be imported to each field in Clarity.
- File fields that are an exact match to Point-in-Time Count Core fields, are automatically mapped to the matching field. Mapping is still editable for these fields.
- The user performs field mapping and clicks save to send it to the server.

Step 3 - Validate
- During this step, the system:
- Generates tables for the parsing of the uploaded files and validate data (use DIT)
- pit_survey_{id}_households
- pit_survey_{id}_individuals
- Load files data to the DB tables (using the mapping above and DIT)
- Validate DB tables data (use DIT) - user sees loader to understand that the file is being processed
- user requests server for file status and possible errors during load/validation (use DIT)
- Generates tables for the parsing of the uploaded files and validate data (use DIT)
- Validation includes:
- File format - the import expects a zip archive with two files:
- Household_Questions_0.csv
- Individual_Questions_1.csv
- Required columns are included in each file
- Custom PIT fields are created in Clarity
- If not, the user sees a list of the missing custom fields and a warning that those fields will be skipped for the import. If the user confirms, the import can continue.
- The values for each column are acceptable
- String data generally has a limit of 255 characters
- File format - the import expects a zip archive with two files:
- After validation is complete, the user clicks ‘Next'
Step 4 - Import Data - the user can view a few summary details about the data file before clicking import.
- Summary details include:
- # of households - count of rows/unique GlobalIDs in Household file.
- # of individuals
- Count of rows/unique GlobalIDs in Individual file.
- # of observation surveys
- Count of rows in the Household file where ‘Survey Type’ = 'Observation'
- # of surveys missing location (x,y coordinates)

- When the user clicks the ‘Import’ button:
- Removes draft status
- Use data stored in the tables pit_survey_{id}households, pit_survey{id}_individuals to show it on the map.

- The workflow sidesheet closes and the system takes the user to the Counts tab. The "in progress" import displays: “File is being imported”
- The user can navigate away from the screen and the import will continue.
Viewing Count Survey Data
Users with the appropriate access can view imported PIT survey data in a list format.
- The Counts tab has a table with one row for each “PIT Year” and “CoC” combination. A column selector is available to customize the user display.
- By default, the following columns are visible:
- CoC
- PIT Year
- Version - One version per CoC and year:
- If users replace the data file by editing the record, the row updates to version 2. If replaced again, version 3, etc. The old data files can be discarded.
- Date Created
- Created by
- File Name/ File size
- The following fields are collapsed by default:
- ID (locked)
- Available as map layer
- Date Updated
- Updated by
- By default, the following columns are visible:

The Counts table also includes search, filter, and sort options.
- Search for Counts by File Name, Year, and CoC
- Filter for Counts by:
- CoC
- Year
- ‘Available as map layer’
- Created by
- Updated by
- Sort for Counts by:
- CoC
- Year
- ‘Available as map layer’
- Created by
- Updated by
- File Name
- Date Created
- Date Updated
- State
- Version
Each table row can be expanded to show fields that are collapsed or that do not fit based on the user’s screen size.

Each table row has an edit icon to “Edit Count Details.”
- When the user clicks on “Edit Count” the Edit Count Details page opens with the following:
- An X icon - use to leave record without changes
- An edit icon
- Replace File option - an upload icon to add or replace files
- Available as map layer field
- PIT Year field
- CoC field
- File name field
- Date Imported date
- Version field
- Last Updated by
- Staff name
- Agency name

When the user clicks on the edit icon, the Edit Count Details page opens with the following:
- An X icon - use to leave the record without changes
- Replace File option - an upload icon to replace or add files
- Available as map layer - editable
- PIT Year field - read only
- CoC field - read only
- File name field - read only
- Date Imported - read only
- Version - read only
- Last Updated by - read only
- If the user replaces the file and clicks save, the system takes them to step 2 of the import count data workflow to complete these steps:
- Field Mapping
- File Validation
- Import
- Once import steps are complete, Version updates to v2 to indicate a replaced file. If replaced again, this increases to v3, etc.
- If the user replaces the file and clicks save, the system takes them to step 2 of the import count data workflow to complete these steps:

A Delete icon is available on the Edit Count Details page. When the user clicks on the Delete icon, a confirmation message appears. The message reads:
“Are you sure you want to delete this Count? Deleted data cannot be restored.”

Count Survey Data Navigation
When a user clicks on a PIT Count in the list of Counts, the system opens a list view of the imported data. Users can choose to view Household or Individual survey-level data.

Household Tab
The Household tab is selected by default and shows the following columns by default:
- Object ID (locked)
- Global ID
- Surveyor Name
- Survey Type
- Sheltered
- Household Type
- Full Sleep Location

There is a column selector available for customizing the view. Additional column options include:
- ID (locked)
- Able to Survey
- Permission to Survey
- Was Already Surveyed
- Sleep Location
- Sleep Location Other
- Number of Adults
- Number of Children
- Total Household
- Veteran Household
- Chronically Experiencing Homelessness Household
- Unaccompanied Youth Household
- Parenting Youth Household
- Under 18 Parent Household
- 18 to 24 Parent Household
- Has Parent(s) with Minor Children
- Head of Household Age
- This Person is Close to
- Address
- Survey End Time
- Creator
- Custom survey fields
Any custom fields mapped during step 2 will be in the Available Fields section of the column selector.
Learn more about customizing your view using column selectors here.
The Household tab has dynamic search, filter, and sort options.
The search options are:
- Object ID
- Global ID
- Surveyor Name
The filter options are:
- Surveyor Name
- Survey Type
- Sheltered
- Household Type
- Veteran Household
- Chronically Experiencing Homelessness Household
- Unaccompanied Youth Household
- Parenting Youth Household
- Under 18 Parent Household
- 18 to 24 Parent Household
- Has Parent(s) with Minor Children
The Sort options are:
- Object ID
- GlobalID
- Surveyor Name
- Sheltered
- Shelter Name
- Able to Survey
- Permission to Survey
- Was Already Surveyed
- Sleep Location
- Sleep Location Other
- Full Sleep Location
- Survey Type
- Number of Adults
- Number of Children
- Total Household
- Veteran Household
- Chronically Experiencing Homelessness Household
- Unaccompanied Youth Household
- Parenting Youth Household
- Under 18 Parent Household
- 18 to 24 Parent Household
- Has Parent(s) with Minor Children
- Head of Household Age
- Household Type
- Survey End Time
- Creator
Search, filter, and sort functionality works the same throughout the new Clarity interface.
Individual Tab
Users can click on the Individual tab to show the following columns by default:
- Object ID (locked)
- Parent Global ID
- Survey Type (Individual)
- Household Type
- Type of Shelter (Individual)

A column selector is available to customize the view. Additional column options include:
- ID (locked)
- GlobalID
- Chronically Experiencing Homelessness
- Unaccompanied Youth
- Head of Household
- Child of Household Member
- Relationship
- Relationship Other
- Race
- Race Other
- Age
- Veteran Status
- First Time Experiencing Homelessness
- How long have you been experiencing homelessness this time?
- Years Experiencing Homelessness
- Days Experiencing Homelessness
- Times Experienced Homelessness
- Total Days Experienced Homelessness
- Substance Use
- Psychiatric Condition
- Physical Disability
- Impacts Job
- Contributing Factors
- Special Education
- HIV/AIDS
- Disability Benefits
- Been Abused
- Creator
- Age Group
Any custom fields mapped in step 2 will be in the Available Fields section of the column selector.
Learn more about customizing your view with column selectors here.
The individual tab has dynamic search, sort, and filter options.
The search options are:
- Object ID
- Global ID
- Parent Global ID
- Surveyor Name
The filter options are:
- Child of Household Member
- Chronically Experiencing Homelessness
- Creator
- Head of Household
- Household Type
- ObjectID
- Parent Global ID
- Survey Type (Individual)
- Type of Shelter (Individual)
- Unaccompanied Youth
The sort options are:
- ObjectID
- GlobalID
- Survey Type (Individual)
- Household Type
- Chronically Experiencing Homelessness
- Unaccompanied Youth
- Head of Household
- Child of Household Member
- Relationship
- Relationship Other
- Age
- Race
- Race Other
- Gender
- Different Identity
- Veteran Status
- First Time Experiencing Homelessness
- How long have you been experiencing homelessness this time?
- Years Experiencing Homelessness
- Days Experiencing Homelessness
- Times Experienced Homelessness
- Total Days Experienced Homelessness
- ParentGlobalID
- Creator
Search, filter, and sort functionality works the same throughout the new Clarity interface.
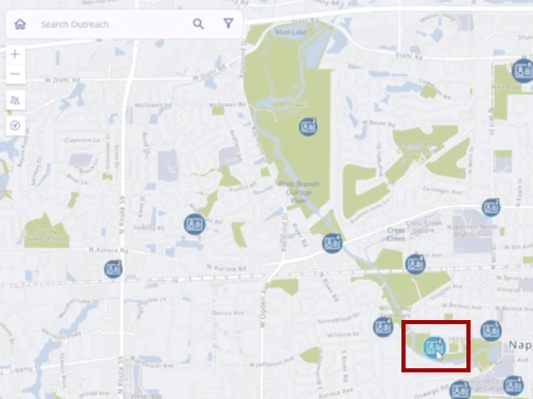
Map Layers
Users with Point-in-Time Data - View access rights can view PIT survey locations within Clarity’s Outreach module and other maps in Clarity.
- Point-in-Time data imported to Clarity is visible as a layer in the Outreach map and Client Location map filter list when ‘Available as map layer’ is enabled for the dataset.
- There is a new Data Type, ‘Unsheltered PIT Counts’
- Unsheltered PIT Counts is a checkbox. When selected, a list of available datasets show, listed by the PIT Year.
- The system shows Counts for the current CoC, based on the user’s agency.
- When the user selects a PIT Year and clicks Apply, the survey locations show on the outreach map with a pin for each survey.
- Uses the x and y coordinate columns in the Households file.
- There is one pin for each Household survey, or cluster of surveys, depending on the scale
- Unsheltered PIT Counts is a checkbox. When selected, a list of available datasets show, listed by the PIT Year.
- Displaying survey locations on the map uses:
- Uses x/y columns for longitude/latitude
- Survey End Date for the date
- Group/Cluster multiple survey locations depending on the scale.
- When a user clicks on a cluster of surveys, they can use < > arrows to switch between surveys.
- When a user hovers over a survey point, the survey point changes color.
- When the user clicks on a survey point, a popup window opens to display the Survey details:
- There is a tab for the user to select to view Household or Individual data. By default, the Households data displays.
- The Household tab shows all fields in the Household survey, including standard and custom fields.
- The Individual tab shows all fields in the Individual survey, including standard and custom fields.
- There is a badge to indicate how many individual surveys are in the Household.
- # of Global IDs connected to the Parent Global ID.
- There is a badge to indicate how many individual surveys are in the Household.

PIT Integration Survey Fields
To download an Excel file with a list of Individual and Household Survey Fields, please click here.
Additional Resources
Updated: 02/10/2026