- Explore - Reservations Model
- Fields
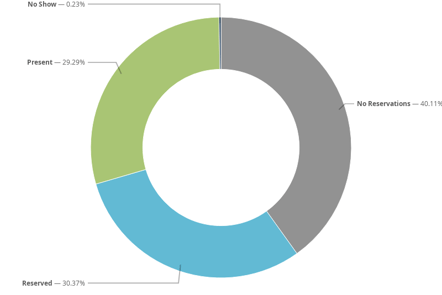
Add the following to the Look:- Status (Reservations)
- Count (Reservation Slots)
- Filters
Change the default filter, Reservation Slots Date to: Is in the past - "1 quarters"
Add additional filters as appropriate- Agency Name
- Reservation Slot Section
- Service or Service Item Name
- Run
In the Visualization pane,
- Change to Pie Chart
- Click on
 to open the Edit panel
 - Make the following adjustments (recommendations only)
- Plot tab
- Value Labels - Labels
- Label Type - Percent
- Inner Radius - 60
- Series tab
- Adjust colors if desired
- Customizations
Change the Null label to "No Reservations"
- Plot tab
To add a title, add the Look to a dashboard. A dashboard can be a single Look.