Purpose
The Program Roster dashboard provides a template similar to the Clarity [GNRL-106] Program Roster report. This dashboard provides information for clients that were engaged with program(s), a client detail list, and general counts for those enrolled, active, and exited within the reporting period.
This dashboard can be used as-is or customized by utilizing the filters provided, or by saving the dashboard to a personal folder to add additional filters or Looks. Steps on how to save this LookML dashboard to customize will be included in this article as well as some inspiration to customize and modify the dashboard for reporting needs.


Dashboard Details
This dashboard is accessible in Looker by utilizing the following pathway:
“All Folders”- “LookML Dashboards”
- “Program Roster
Once selected, your dashboard will begin to run. This dashboard utilizes the HMIS Performance Model.
Filters

The following filters are available for this dashboard:
- Reporting Period Filter
- Select the Reporting Period for the dashboard.
- Default: ”is in the last 1 quarter”
- Program CoC
- Select the CoC(s) to include in the dashboard.
- Agency Name
- Select the Agency(-ies) to include in the dashboard.
- Project Type Code
- Select Project Type(s)
- Program Name - Selection Required
- Select the name(s) of programs to include in the dashboard.
- Note: Program CoC, Agency Name, and Project Type Code selections will update which Programs are available within the Program Name filter options.
- Head of Household (Yes/No)
- Select “Yes” to only include Head of Households. Filter defaults to include all household members.
- Currently Active in Project, Project Start Date, and Project Exit Date
- These filters are utilized to mimic status parameters in the Clarity [GNRL-106] Program Roster, use the “Project Start Date” and “Project Exit Date” filters to obtain the desired status options.
- Active in Report Date Range: Leave ‘Project Start Date’ and ‘Project Exit Date’ filters set to ‘is any time’
- Exited within Report Date Range: Set ‘Project Exit Date’ filter equal to the ‘Reporting Period Filter’
- Enrolled within Report Date Range: Set ‘Project Start Date’ filter equal to the ‘Reporting Period Filter’
- These filters are utilized to mimic status parameters in the Clarity [GNRL-106] Program Roster, use the “Project Start Date” and “Project Exit Date” filters to obtain the desired status options.
Tile Overview
The dashboard contains 5 tiles that include similar information to the Clarity [GNRL-106] Program Roster report. The tiles capture data that encompass counts of clients, households, and enrollments within programs selected within the filters - as well as a client detail list. This dashboard can be utilized as is, or customized for reporting needs.
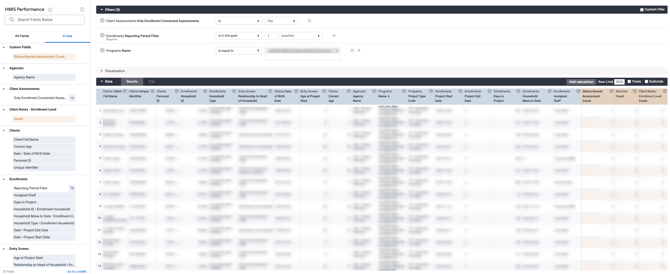
Program Roster
This Look contains a table visualization with a program-based client detail list
Applicable Filters: Reporting Period, Program CoC, Agency Name, Project Type Code, Program Name, Head of Household, Currently Active in Project, Project Start Date, and Project Exit Date
- Custom Fields
-
- Status/Annual Assessment Count
- Field to Measure: Status Update Screen - ID
- Measure Type: Count Distinct
- List of Assigned Staff
- Dimension: Enrollments - Assigned Staff
- Aggregate Type: List of Unique Values
- Status/Annual Assessment Count
-
- Dimensions
-
- Agencies - Agency Name
- Clients - Client Full Name
- Clients - Current Age
- Clients - Date • Date of Birth
- Clients - Personal ID
- Clients - Unique Identifier
-
- Enrollments - Days in Project
- Note: Days in Project calculates Length of Time differently than the Clarity Program Roster report. Days in Project reflects the number of days between Project Start Date and Project Exit Date. If the client has not exited, the end date for the calculation is the current date.
- Enrollments - Household ID • Enrollment Household
- Enrollments - Household Move-In Date • Enrollment Household
- Enrollments - Household Type • Enrollment Household
- Enrollments - Date • Project Exit Date
- Enrollments - Date • Project Start Date
- Entry Screen - Age at Project Start
- Entry Screen - Relationship to Head of Household • Enrollment Household
- Programs - Name
- Programs - Project Type Code
- Enrollments - Days in Project
- Measures
-
- Client Notes - Enrollment Level - Count
- Services - Count
- “Explore from Here”
- Services Count and Client Notes - Enrollment Level Count columns have drilldown functionality. drilldowns include additional information about the services and notes that are applicable to the chosen count.
- This drilldown is available by selecting the value within the table on the dashboard or by selecting “Explore from Here”, then selecting the value within the table.
- drilldowns are not available for dimensions however, dimensions can be filtered by clicking on the information within the cell (i.e., filtering on a Household ID or a particular Household Type, Project Type, or Assigned Staff member).
- Services Count and Client Notes - Enrollment Level Count columns have drilldown functionality. drilldowns include additional information about the services and notes that are applicable to the chosen count.
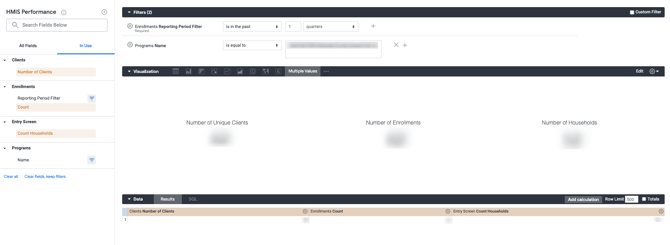
Client & Household Counts
This Look contains a multiple value visualization with a count of unique clients, enrollments, and households.
Applicable Filters: Reporting Period, Program CoC, Agency Name, Project Type Code, Program Name, Head of Household, Currently Active in Project, Project Start Date, and Project Exit Date
- Measures
-
- Clients - Number of Clients
- Enrollments - Count
- Entry Screen - Count Households
- “Explore from Here”
- There are two ways to explore this Look to obtain more information.
- Select “Explore from Here”, then click on any count in the data section for a drilldown.
- Number of Clients drilldown contains Personal ID, Unique Identifier, Client Full Name, and Current Age.
- Number of Enrollments drilldown contains Personal ID, Enrollment ID, Head of Household (Yes/No), Program Name, Project Start Date, Project Exit Date, and Housing Move-in Date.
- Number of Households drilldown contains Screen ID, Household ID, Personal ID, Unique Identifier, Client Full Name, Project Start Date, and Project Exit Date.
- This drilldown Looks can also be achieved by selecting any count on the dashboard tile.
- Select “Explore from Here”, then click on any count in the data section for a drilldown.
- There are two ways to explore this Look to obtain more information.
Active During Reporting Period
This Look contains a single value visualization with the count of clients that are active during the reporting period.
Applicable Filters: Reporting Period, Program CoC, Agency Name, Project Type Code, Program Name, Head of Household, and Currently Active in Project.
- Measures
-
- Clients - Number of Clients
- “Explore from Here”
- There are two ways to explore this Look to obtain more information.
- Select “Explore from Here”, then click on the count in the data section for a drilldown containing Personal ID, Unique Identifier, Client Full Name, and Current Age.
- This drilldown Look can also be achieved by selecting the count on the dashboard tile.
- There are two ways to explore this Look to obtain more information.

Enrolled During Reporting Period
This Look contains a single value visualization with the count of clients that were enrolled during the reporting period.
Applicable Filters: Reporting Period, Program CoC, Agency Name, Project Type Code, Program Name, Head of Household, and Currently Active in Project.
- Custom Filter
- Enrolled within the Reporting Period:
${enrollments.start_date}>=${enrollments.reporting_period_start_date}
AND ${enrollments.start_date}<${enrollments.reporting_period_end_date}
- Measures
-
- Clients - Number of Clients
- “Explore from Here”
- There are two ways to explore this Look to obtain more information.
- Select “Explore from Here”, then click on the count in the data section for a drilldown containing Personal ID, Unique Identifier, Client Full Name, and Current Age.
- This drilldown Look can also be achieved by selecting the count on the dashboard tile.
- There are two ways to explore this Look to obtain more information.

Exited During Reporting Period
This Look contains a single value visualization with the count of clients that have exited during the reporting period.
Applicable Filters: Reporting Period, Program CoC, Agency Name, Project Type Code, Program Name, Head of Household, and Currently Active in Project.
- Custom Filter
-
- Exited within the Reporting Period:
${enrollments.end_date}<${enrollments.reporting_period_end_date}
- Measures
-
- Clients - Number of Clients
- “Explore from Here”
- There are two ways to explore this Look to obtain more information.
-
-
- Select “Explore from Here”, then click on the count in the data section for a drilldown containing Personal ID, Unique Identifier, Client Full Name, and Current Age.
- This drilldown Look can also be achieved by selecting the count on the dashboard tile.
-

Customizing the Program Roster Dashboard
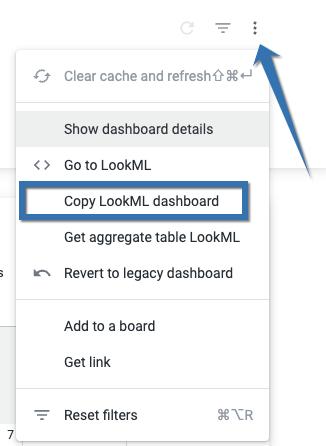
This dashboard was designed to provide a dashboard template based on the Program Roster report to allow customizations and modifications instantly. To customize this dashboard, select the kebab menu in the upper right corner of the dashboard screen and select “Copy LookML Dashboard”.
A pop-up screen will appear to update the dashboard title and select where the copied dashboard will be saved. Once saved, the dashboard can be altered and customized as needed like any other dashboard. When adding new Looks or Filters, make sure to update the filters to include applicable tiles. 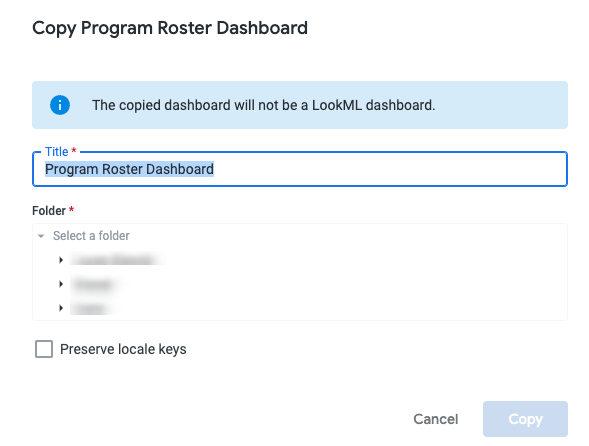
Listed below are a few ways to customize and modify the dashboard to fit community, agency, or program needs.
- Filters
- Additional filters can be added like assigned staff, current age, race, ethnicity, or veteran status.
- Current default filters can also be updated.
- Looks
- If there are fields within the Program Roster Look that do not apply to your analysis/review efforts or if additional information is desired within the table, simply add/remove the fields within the Look.
- Additional Looks can also be added to the dashboard. For example, Looks highlighting demographic information, general coordinated entry assessment reviews, clients per staff member, data quality, and/or data entry timeliness could be beneficial for this dashboard.
- Once your Look is created and ready to be saved to the dashboard, save the Look by selecting the Gear icon in the upper right corner and then select Save and To an Existing Dashboard. After this Look is saved to the dashboard, the existing filters can be updated to include the new Look and the placement of the tile can be updated.
- Note: Dashboards are limited to 25 queries/tiles to ensure performance. For more information about Looker best practices and usage policies, please review these Looker Reporting Best Practices and Dashboard and Look Usage Policies.
Sample Looks
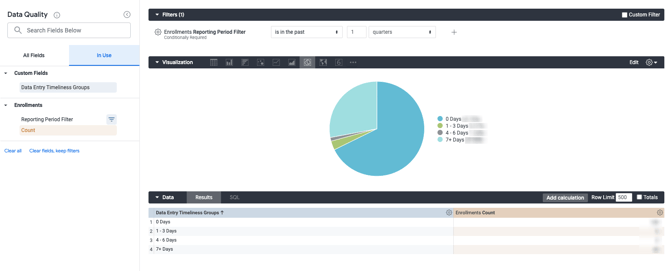
Data Entry Timeliness
Using the Data Quality Model, a Look for general Data Entry Timeliness can be created to add to the Program Roster dashboard. With the fields below, a Look can be created that captures how many enrollments were compliant with data entry timeliness guidelines. Enrollments - Counts will provide a drilldown with a client list.
- Custom Fields
-
- Custom Dimension
- Data Entry Timeliness Groups
- Custom Dimension
-
-
-
- Group by: Enrollments - Data Entry Timeliness
- 0 Days, 1-3 Days, 4-6 Days, and 7+ Days
-
-
- Measures
- Enrollments - Count
Age Tiers
Using the HMIS Performance Model, this general template can be utilized to create Looks with demographic information. This particular Look will provide a count of clients within each age tier. Number of Clients will provide a drilldown with a client list.
- Dimensions
- Entry Screen - Age Tiers
- Measures
- Clients - Number of Clients

Days in Project by Household Type
Using the HMIS Performance Model, this general template can be utilized to create an analysis of the length of time in the project by various enrollment or demographic data points. This particular Look will provide data for Days in Project Tiers by Household Type. Enrollments - Counts will provide a drilldown with a client list.
- Dimensions
- Enrollments - Days in Project Tier
- Note: For custom tiers, use Enrollments - Days in Project, hover over the dimension, click on the kebab menu icon, and select Group.
- Enrollments - Days in Project Tier
-
- Enrollments - Household Type (Pivoted)
- Measures
- Enrollments - Count

Client Count by Assigned Staff
Using the HMIS Performance Model, this Look will highlight the count of enrollments per assigned staff person within the reporting period. Enrollments - Counts will provide a drilldown with a client list.
- Dimensions
- Enrollments - Assigned Staff
- Measures
-
- Enrollments - Count
- Custom Fields
-
- Percent of Enrollments Count
- Calculation: % of Column
- Source Field: Enrollments Count
- Format: Percent, 0 Decimals
- Percent of Enrollments Count

Updated: 09/09/2024