Purpose
The Population Over Time Model is designed to analyze long term trends in your data and complete longitudinal analysis. This model includes data for clients with an enrollment history in a project to analyze effectiveness, growth, and other system insights. Longitudinal analysis utilizing this model can be broken down into weekly, monthly, quarterly or yearly intervals on any given day for the identified reporting range to review trends and evaluate programs for a two year lookback period (730 days prior to the date the query is run).
The Population Over Time model was not designed to be a client-based model. This model is focused to analyze your community’s effectiveness.
The data within this model is calculated week by week (Monday - Monday). Keep this in mind while using this model which can affect weekly, monthly, quarterly, and yearly analysis when the time range does not begin on a Monday.
At the end of this article, there are instructions for creating sample looks with the Population Over Time model.
Overview
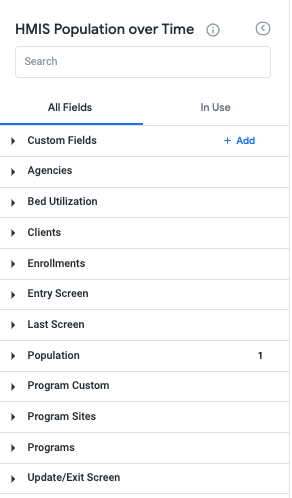
The Population Over Time model includes the following views:
- Agencies
- Includes basic information about the Agency
- Compares with Organization table in HUD CSV/XML
- Information comes from the Manage > Agencies > Agencies Overview screen
- Bed Utilization
- Information from the Manage > Programs > Bed & Unit Inventory
- Note: Bed Utilization will be undergoing improvements in the near future to account for variable bed inventory over time.
- Clients
- Static demographic fields such as Name, Date of Birth, Social Security Number, Veteran Information, etc.
- Information found on the Client Profile screen
- Entry Screen
- Information collected at the point of project enrollment
- Last Screen
- Information collected from the exit screen
- If there is no data in the exit screen, the data is from the most recent update screen
- Information collected from the exit screen
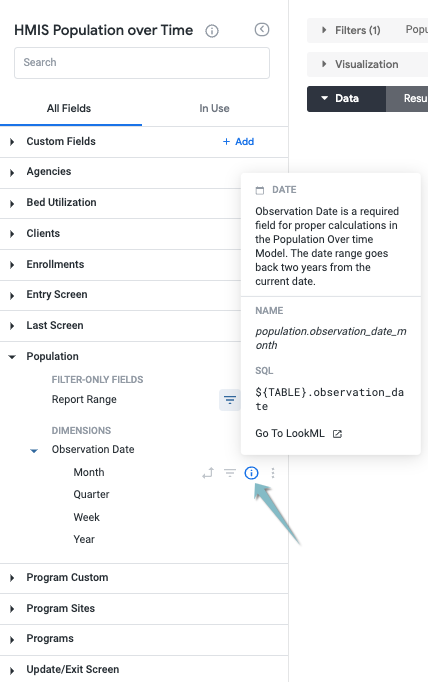
- Population
- This view is unique to the Population Over Time model
- Includes:
- Report Range filter
- Defaults to “is in the past 6 months”
- Observation Date interval dimension
- Most granular interval is week
- Report Range filter
- Note: The Report Range filter and Observation Date dimension are required for Looks utilizing the Population Over Time model.
In addition, the model includes the following which are also found on most other client-centered models:
- Clients
- Fields are from the Profile screen
- Custom Profile fields are included in this section
- Enrollments
- This section includes dimensions related to the enrollment:
- Project Start & End Dates
- Household Configuration
- Average Days in Project
- Latest Move-in Date
- Days from Project Start to Move-in
- This section includes dimensions related to the enrollment:
- Program Sites
- Information from Manage > Programs > Sites
- Programs
- Information from Manage > Programs > Sites
Note: For more information on specific dimensions or measures, refer to the ![]() (information bubble) available next to some of the field names.
(information bubble) available next to some of the field names.
Float your cursor over the field and select the information bubble for a brief description.
Sample Looks
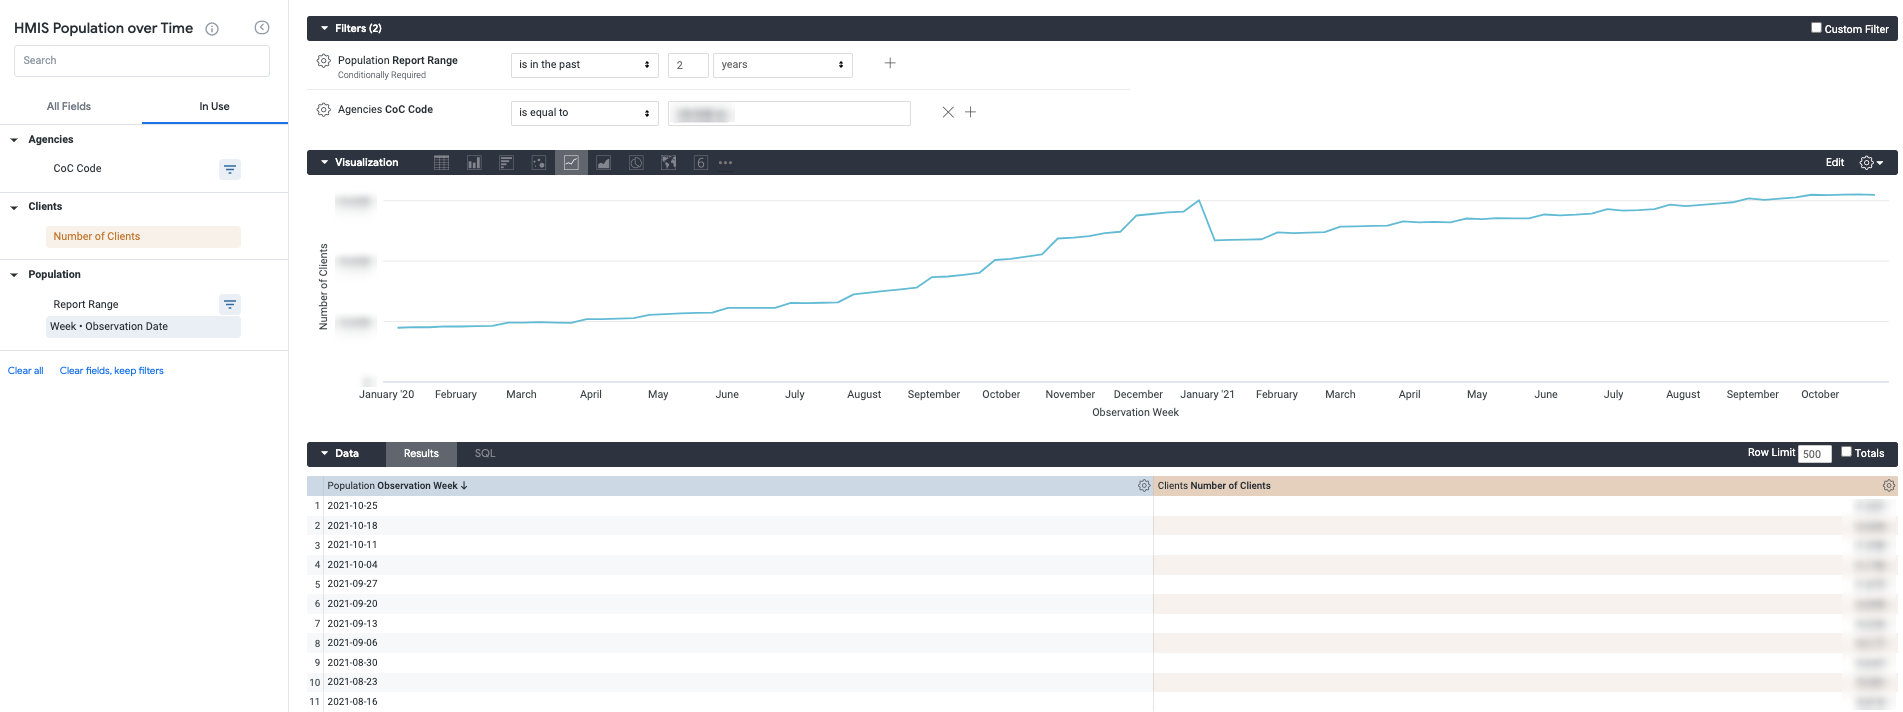
Total Persons Served
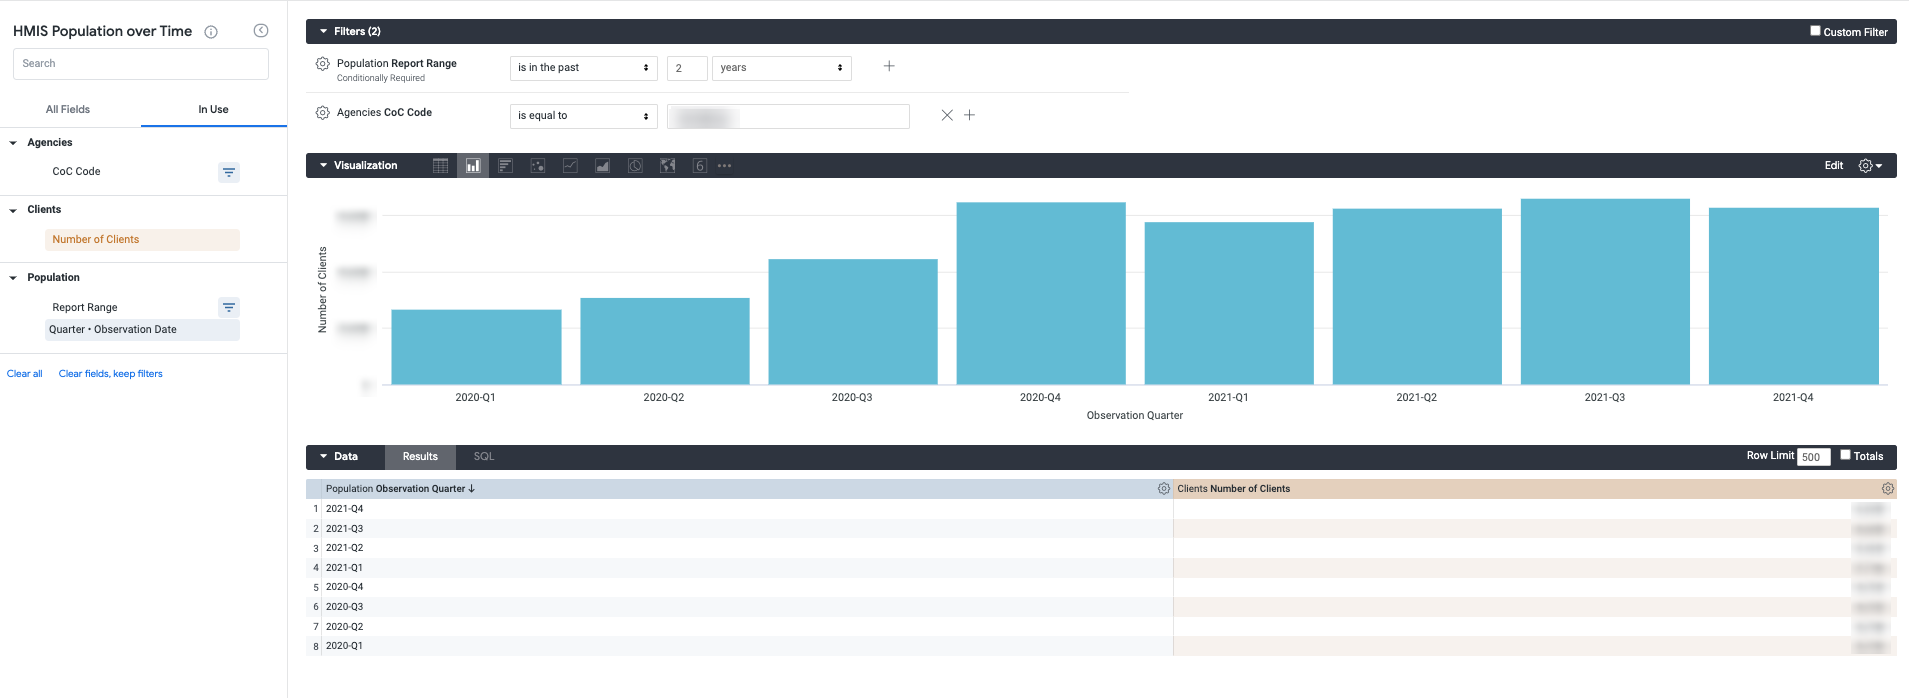
Utilize the prompts below to create a Look and visualization to view persons served by week with a trend line visualization.
Filters
- Population - Report Range
- Agencies - CoC Code
Dimensions
- Population - Observation Date - Weekly
Measures
- Clients - Number of Clients
Visualization
Select the “Line” visualization and your preferred color for the chart to review potential trends in persons served.
The Look below utilizes a “Column” visualization and a quarterly Observation Date.
Further Analysis
To build off of this Look for additional analysis, pivot by various demographics like the Veteran Status, Gender or Race dimensions.
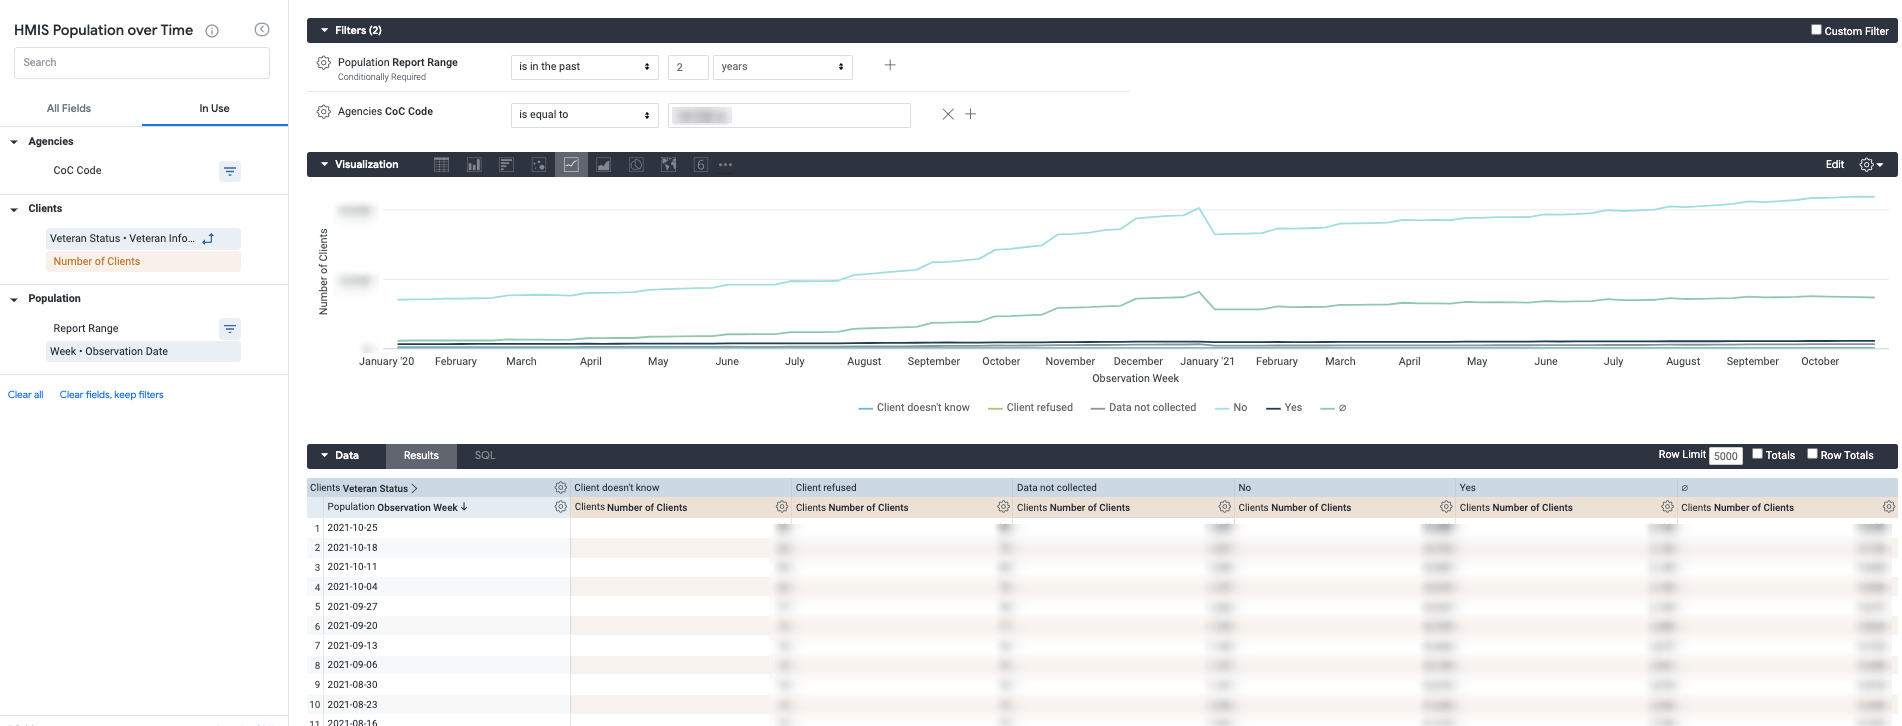
Further Analysis Sample Look featuring total persons served with weekly intervals by Veteran Status.
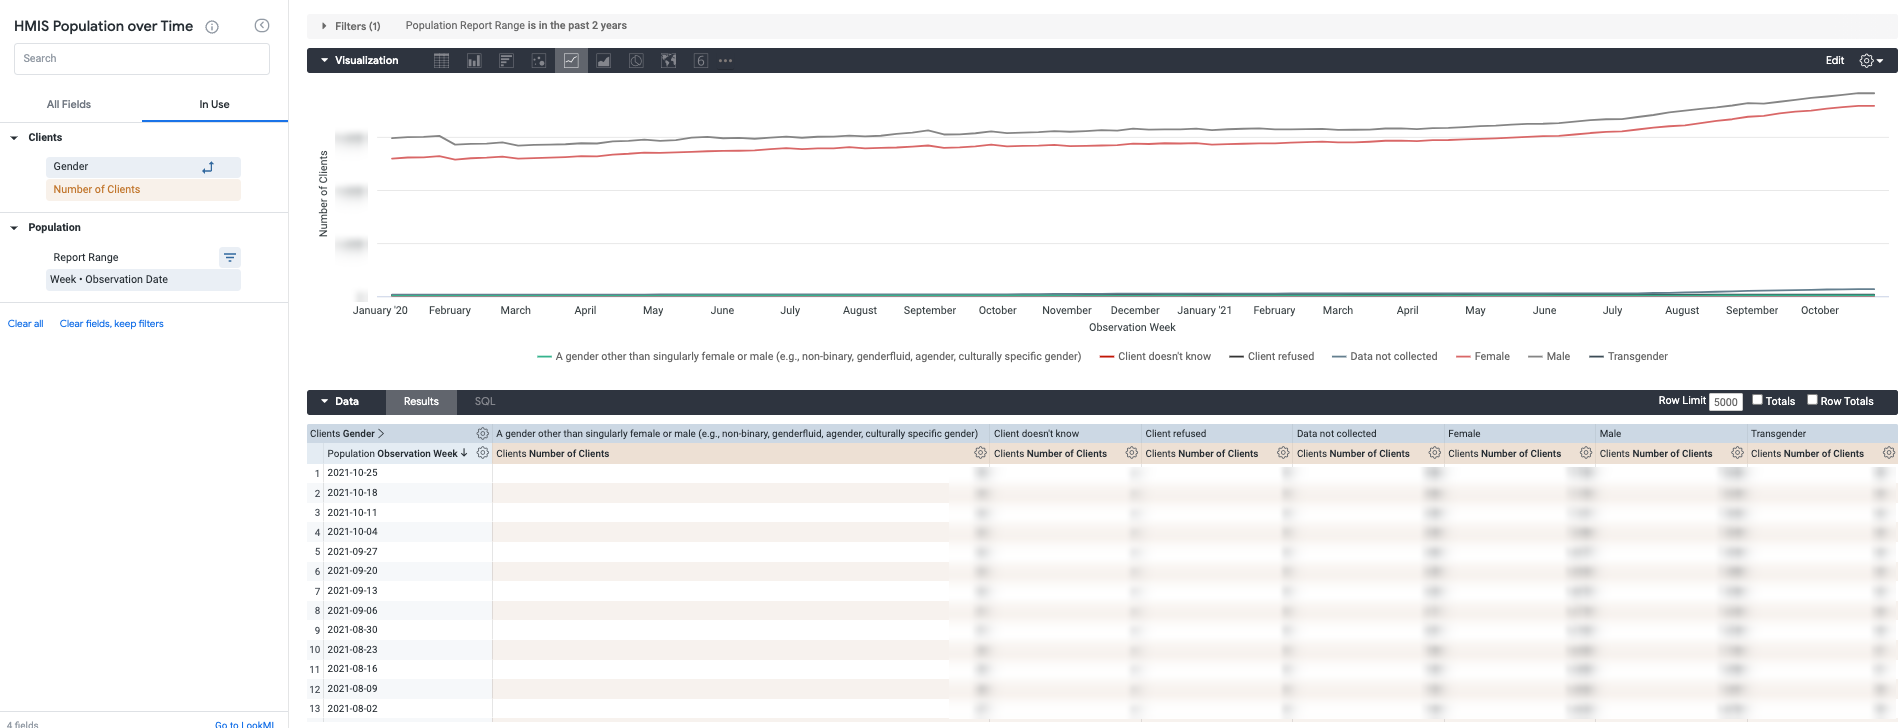
Further Analysis Sample Look featuring total persons served with weekly intervals by Gender.
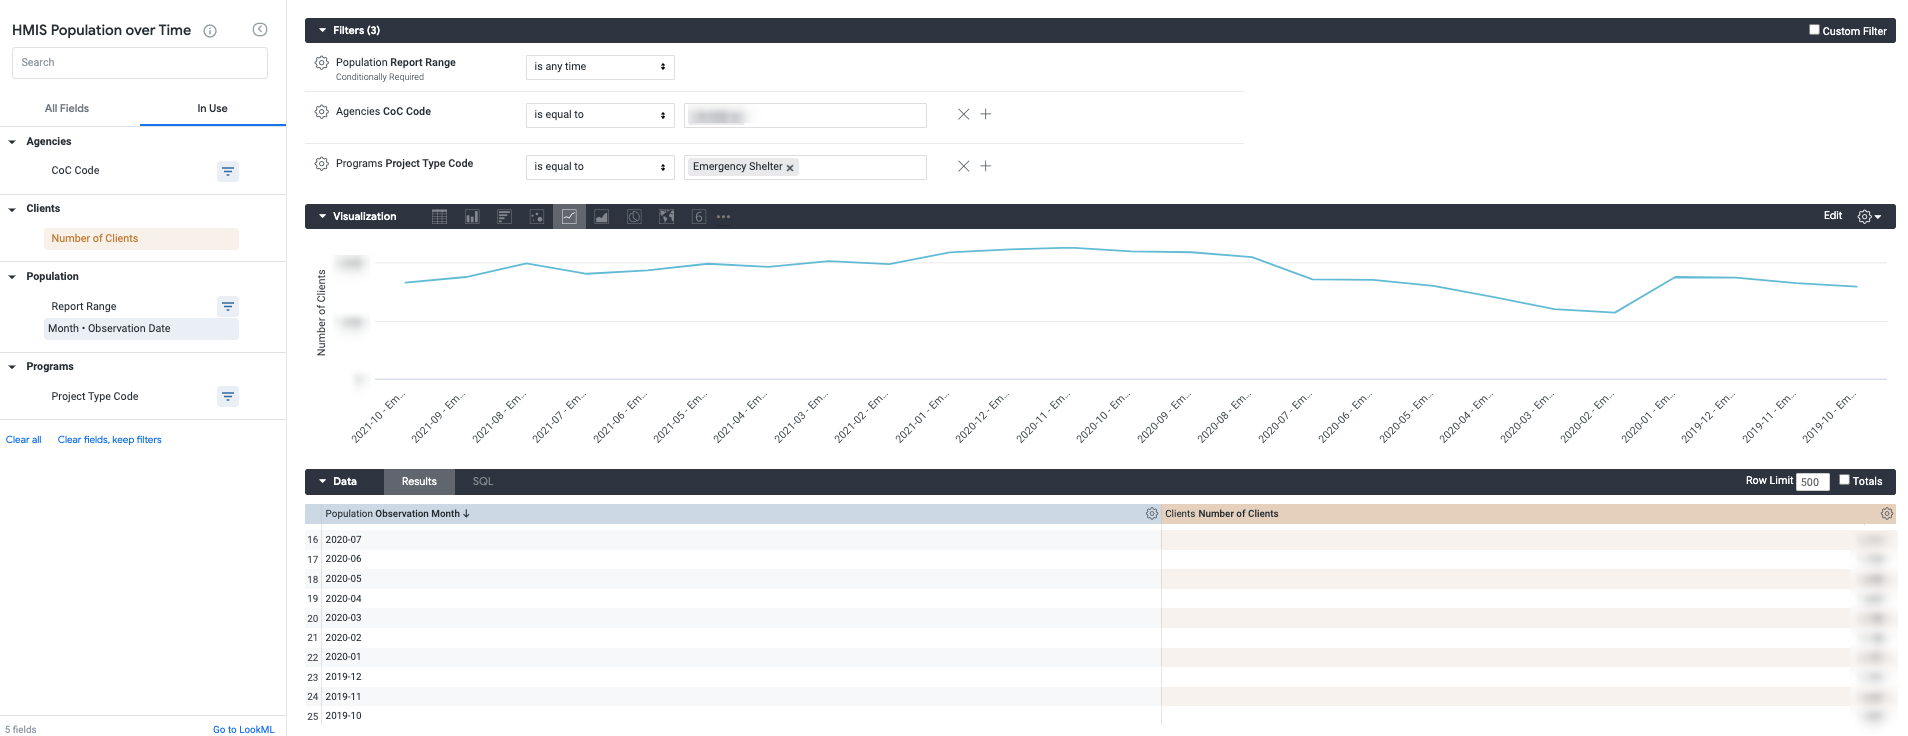
Project Type Evaluation
This Look will highlight a monthly, project specific trend line for the number of clients enrolled. This example will be filtered to Emergency Shelter projects. The prompts listed below to create the Look and visualization.
Filters
- Population - Report Range
- Agencies - CoC Code
- Programs - Project Type Code
- This sample uses an emergency shelter filter
Dimensions
- Population - Observation Date - Month
Measures
- Clients - Number of Clients
Visualization
Select the “Line” visualization and your preferred color for the chart to review potential trends for the emergency shelters within this community.