Report Purpose & Summary
This program-based report measures program performance. It is intended to be used for the NoFA competition and can be used in comparing program performance.
Running the Report
Who Can Run the Report
All users can run the report. There are restrictions on which information can be accessed based on the user's access rights.
The Admin version of the report can be run across agencies by System Administrators and others with the appropriate access roles.
Report Location
This report can be found in the following locations in the Report Library:
- Program Based Reports → [OUTS-102] Performance Monitoring
- Administrator Reports → [OUTS-102-AD] Performance Monitoring
Parameters
The following parameters are required to run this report:
| Project Type(s) |
Select a Project Type to filter the choices available in the Program(s) parameter: All, Single Select, or Multi-Select (Hold Control/Command or Hold Shift to select multiple options sequentially.) |
| Program(s) |
Select which program(s) to include: All, Single Select, or Multi-Select (Hold Control/Command or Hold Shift to select multiple options sequentially.) |
| Report Date Range | Choose the date range of enrollments to include |
| Report Output Format | Web Page, PDF, or Excel |
Additional Administrator Report Parameters
| Agency CoC |
|
| Agency Status |
|
| Agency(-ies) |
Select which agency(ies) to include: All, Single Select, or Multi-Select (Hold Control/Command or Hold Shift to select multiple options sequentially.) |
Report Details
This report generates information regarding program performance. It enables outside entities to apply scores/grades to agency programs.
Although you can select multiple programs in the parameters, this report does not categorize results by program; the totals provided are conglomerate scores of all programs selected in the parameters.
To be included in the report, the household must have one valid Head of Household.
The report provides information on 4 categories of performance:
- Project serves “harder to serve” homeless populations
- Reduce length of homeless episodes and new and return entries into homelessness
- Increase jobs, income and self-sufficiency
- HMIS Participation and Data Quality
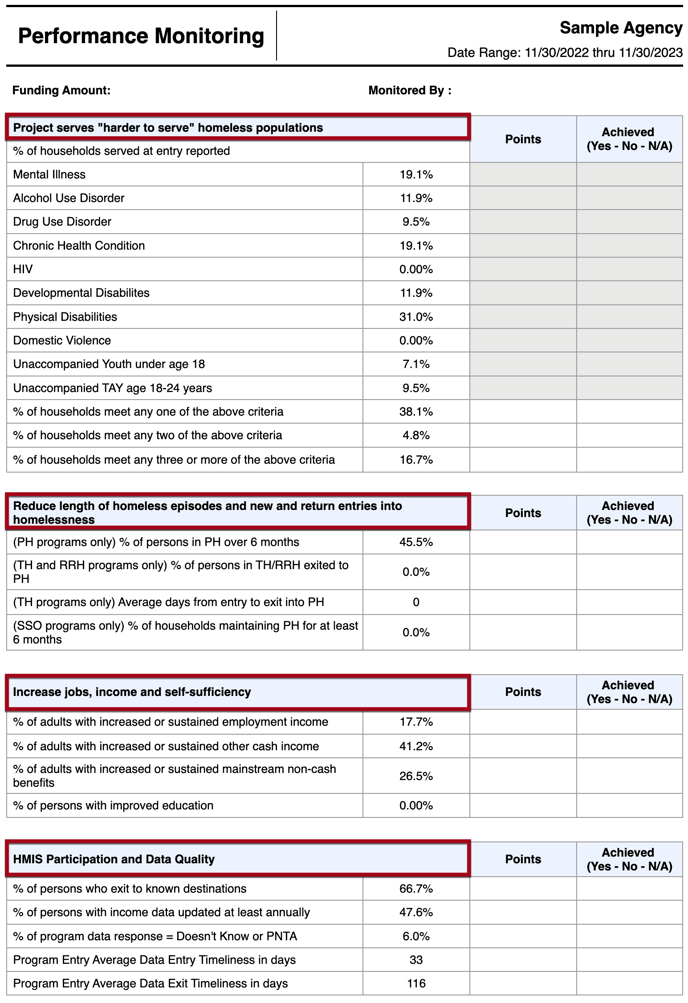
Project serves “Harder to Serve” homeless populations
This section captures the percentage of households served who reported at least one of the criteria listed below: (A household can be comprised of one individual).
- Mental Illness
- Alcohol Use Disorder
- Drug Use Disorder
- Chronic Health Condition
- HIV
- Developmental Disabilities
- Physical Disabilities
- Domestic Violence
- Unaccompanied Youth under age 18
- Unaccompanied TAY age 18-24 years
- % of households meet any one of the above criteria
- % of households meet any two of the above criteria
- % of households meet any three or more of the above criteria
The default source of this information is the program enrollment screen.
If the client has more than one project stay during the report date range, the most recent project stay is used.
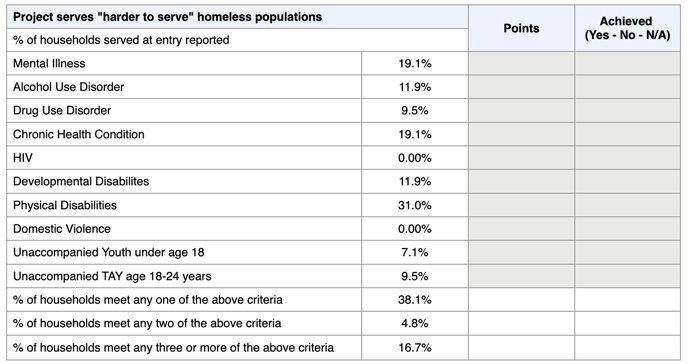
Reduce length of homeless episodes and new and return entries into homelessness
This section pertains only to the following project types:
-
[Project Type] = 3: Permanent Supportive Housing (disability required for entry)
-
[Project Type] = 9: PH – Housing only
-
[Project Type] = 2: Transitional Housing
-
[Project Type] = 13: PH - Rapid Re-Housing
-
[Project Type] = 4: Street Outreach
-
[Project Type] = 6: Services Only
The following are considered permanent housing destinations. For the most up-to-date list, refer to HUD HMIS Data Dictionary, Appendix A, Destination.
- Staying or living with family, permanent tenure (422)
- Staying or living with friends, permanent tenure (423)
- Moved from one HOPWA funded project to HOPWA PH (426)
- Rental by client, no ongoing housing subsidy (410)
- Rental by client, with ongoing housing subsidy (435)
- Owned by client, with ongoing housing subsidy (421)
- Owned by client, no ongoing housing subsidy (411)
| (PH programs only) % of persons in PH over 6 months | Automatically calculated from the Date field of the program entry and program exit screens (or [report end date] if program end date is null) of PH programs only ([Project Type] = [3, 9]) |
| (TH and RRH programs only) % of persons in TH/RRH exited to PH | Automatically calculated from the Destination data field on the TH/RRH program exit screen ([Project Type] = [2, 13]) |
| (TH programs only) Average days from entry to exit into PH | This timeframe is automatically calculated from the Date fields of the program entry and program exit screens of TH programs ([Project Type] = [2]), along with the Destination data field on the TH program exit screen. This will be an integer value as opposed to a percentage. |
| (SSO programs only) % of households maintaining PH for at least 6 months | This information is automatically calculated from the Date fields of the follow-up collection and program exit screens of SSO programs ([Project Type] = [4, 6]). The difference between follow-up collection date and program end date should be >= 180 days. |
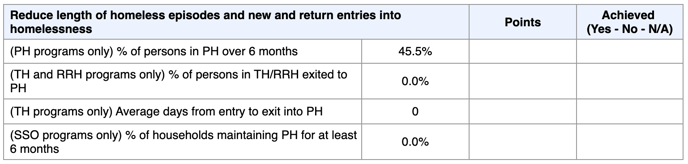
Increase jobs, income, and self-sufficiency
This section displays data on Cash/Non-Cash Income and Education. The percentages show those clients who have sustained or increased the amount of income of both types throughout their enrollment. A percentage of clients who have increased their level of education is also included.
| % of adults with increased or sustained employment income | This section reports a percentage of persons in program(s) with an amount associated with Earned Income on either program status assessment or program exit that is equal to or more than Earned Income amount at program entry. |
| % of adults with increased or sustained other cash income |
This section reports a percentage of clients whose [Total Cash Income for Individual] - [Earned Income Amount] on either program status assessment or program exit is equal to or more than at program entry. |
| % of adults with increased or sustained mainstream non-cash benefits | This section reports a percentage of clients who either had the same benefit(s) from entry to program status assessment/program exit OR client gained any of these benefits from program entry to program status assessment/program exit.
|
| % of persons with improved education | This section reports a percentage of clients who have the Currently Enrolled in School field set to true, OR the Highest Level of School Completed field has increased in value, OR the Earned Degree field has become active or remained the same during the enrollment period. |
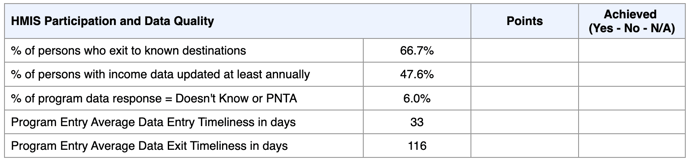
HMIS Participation and Data Quality
This section displays data quality information related to enrollment exit destinations that can be verified and known when a client leaves a program. Also included is a percentage of clients who have had their income records updated annually. Percentages of clients who have Doesn’t Know or PNTA (Prefers not to answer) selected for any program-based screen is also included as well as average days between actual program enrollment or exit and Clarity record creation for each.
| % of persons who exit to known destinations | Derived from the Destination data field on the program exit screen. |
| % of persons with income data updated at least annually | Derived from any income-related data field on program exit screens and assessment screens (adults only). |
| % of program data response = Doesn’t Know or PNTA | Total amount of times the Doesn’t Know or PNTA data field is selected on any program-based screen. |
| Program Entry Average Data Entry Timeliness in days | This represents the average number of days between the client enrolling into the program and when the enrollment record was created in the Clarity system. Clients must have program start date within the report date range to be included in average timeliness calculations. |
| Program Entry Average Data Exit Timeliness in days | This represents the average number of days between the client exiting the program and when the exit record was created in the Clarity system. Clients must have program end date within the report date range to be included in average timeliness calculations. |
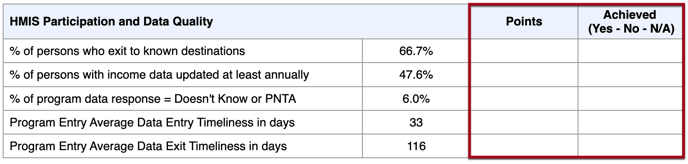
Points and Achieved (Yes, No, N/A) Columns
There are two columns located to the right of each of the 4 categories described above:
- Points
- Achieved (Yes, No, N/A)
These are quality-based categories that are determined by the evaluating parties. Therefore, the characteristics of these categories are subjective, and will be unique to each agency.
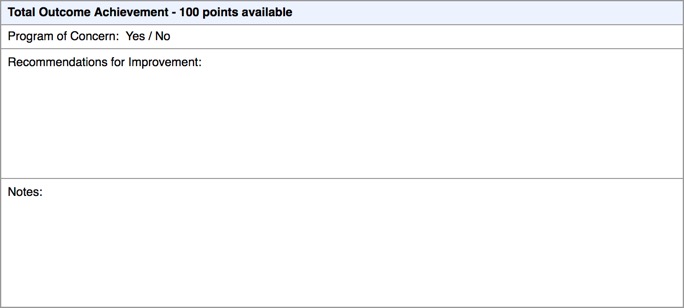
Total Outcome Achievement – 100 points available
This is the total from the Points column, thus it is subjective and will be unique to each agency.
Drilldown Functionality
Drilldown functionality is available for this report. Drilling down on a ‘%’ will yield a list of all clients associated with that list.
The information in the screenshot below is available for each drilldown.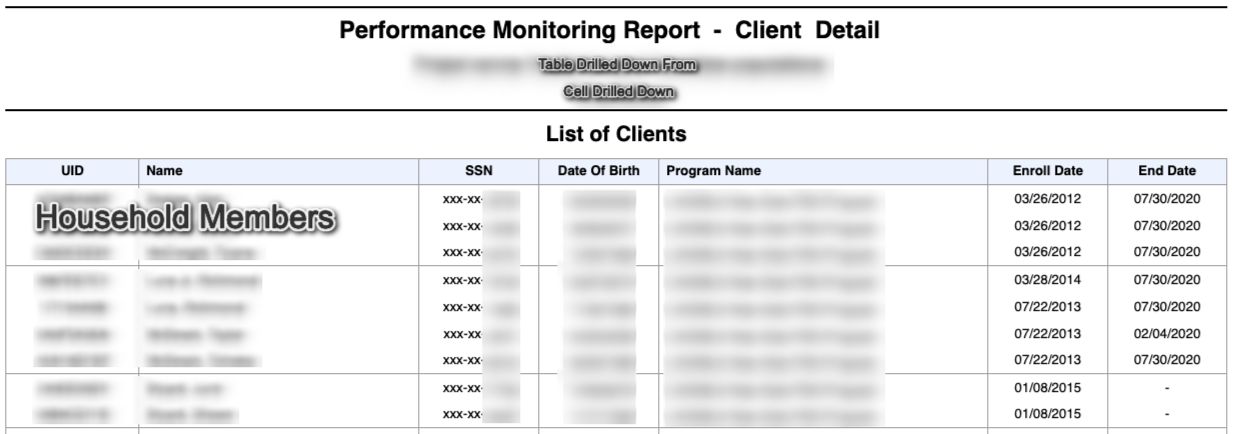
Updated: 07/09/2024