With the Outreach Model, a table with a count of clients per encampment is able to be created with a few clicks. This Look includes a count of active clients that are currently present at each encampment.

The steps below outline how to create this Look.
1. Explore - Outreach Model2. Fields
Add the following fields to the Look:
-
- Dimensions
- Encampments – ID
- Dimensions
-
-
- Encampments – Name of Encampment
-
-
- Measures
-
-
- Clients – Count Client IDs
-
3. Filters
Add the following fields as filters to the Look:
- Encampment Stays – Client Active (Yes/No): is Yes
- Encampments – Encampment Active (Yes/No): is Yes
- Encampment Stays – Is Current Encampment (Yes/No): is Yes
Select Totals in the Data Toolbar for an unduplicated active client count. Update the Row Limit as needed.
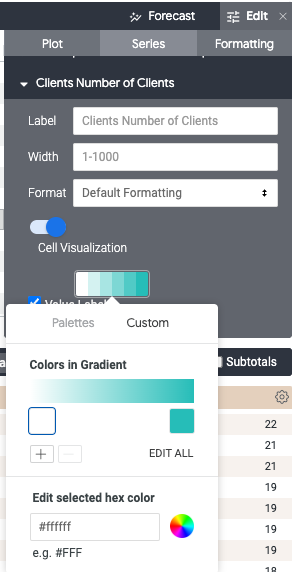
4. Visualization - TableTo include Cell Visualizations for Number of Clients, complete the following steps.
-
- Select Edit in the Visualization toolbar
- Select Series
- Select Clients Number of Clients in the Customizations section
- Toggle On Cell Visualization and select desired palette/custom gradients
![]() Updated: 06/18/24
Updated: 06/18/24