The New Customer Configuration dashboard was created to allow a way to monitor and review new customer configurations during set up in Clarity. The dashboard is broken down into eleven sections (CoC, Agency, Program, User, Screens, Templates, Services, Bed and Unit Inventory, Sharing Settings, Community Queue and CE Assessment Information) to ensure convenient review of information with ease. With filters, explore options, and the initial dashboard view, set up progress and needs can be easily identified. From a high-level, this dashboard will also be valuable to audit and review system configuration outside of the initial set up process as well.


Dashboard Details
This dashboard is accessible in Looker by utilizing the following pathway:
- “All Folders”
- “LookML Dashboards”
- “New Customer Configuration Dashboard”
- “LookML Dashboards”
Once selected, your dashboard will begin to run. This dashboard utilizes the Project Descriptor Model.
Filters

The following filters are available for this dashboard:
- CoC Code
- Select the CoC(s) to include in the dashboard. Once selected Agency Name, Program Name and Project Type filters will update to only reflect information associated with the CoC(s) selected.
- Agency Name
- Select the Agency(-ies) to include in the dashboard. Like the CoC Code, this filter will also update Program Name to only include programs associated with the selected agency(-ies).
- Agency Status
- Select the Agency Status (Active/Inactive Filter)
- Default: Active
- Program Name
- Select the name(s) of programs to include in the dashboard.
- Program Status
- Select the Program Status (Active/Inactive Filter)
- Default: Active
- Project Type
- Select Project Type(s)
- Screen Status
- Select the Screen Status (Active/Inactive Filter) to filter tiles in the Screen Information section
- Default: Active
- Staff Status
- Select the Staff Status (Active/Inactive Filter) to filter tiles in the User Information section
- Community Queue Status
- Select the Queue Status (active/Inactive Filter) to filter tiles in the Community Queue and CE Assessment Information sections
- Default: Active
Filter Breakdown
The list below highlights which filters apply to which sections of the dashboard. In addition to this reference, each tile has an info bubble next to the Look’s title that contains a list of all applicable filters.
- CoC Information, Agency Information, Program Information, Template Information, Services Information, Current Bed and Unit Inventory Information
- Applicable Filters: CoC Code, Agency Name, Agency Status, Program Name, Program Status, Project Type
- User Information
- Applicable Filters: Staff Status
- Screen Information
- Applicable Filters: Screen Status
- Sharing Settings
- Applicable Filters: CoC Code, Agency Name, Agency Status, Project Type
- Community Queue Information; Looks: CE Assessments Count and CE Assessing Program -> CE Assessments -> Community Queue Flow
- Applicable Filters: CoC Code, Community Queue Status
- Assessment Details Look
- Applicable Filters: Community Queue Status
All filters are optional. However, utilizing filters may make analysis of set up more streamlined. Filters in this dashboard are not limited to single select.
Tile Overview
The dashboard contains 11 sections highlighting various counts, charts and tables associated with agencies, programs, users, screens, templates, services, bed and unit inventory, sharing settings, community queue, and CE assessments that are currently in Clarity.
CoC Information
CoCs in Clarity
This Look contains a single value visualization of the current count of CoCs that are in Clarity.
- Custom Fields
-
- Count of CoC Code (Agencies)
- “Explore from Here”
- There are no drill downs available for this Look.

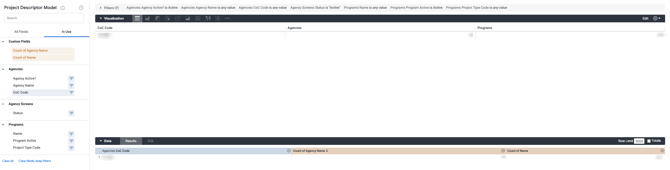
Agency & Program Count per CoC
This Look contains a table with a list of applicable CoC Codes and associated Agency and Program counts for each CoC.
- Dimensions
-
- CoC Code
- Custom Fields
-
- Count of Agency Name
- Count of Name (Program)
- “Explore from Here”
-
- There are no drill downs available for this Look. Information on Agencies and Programs will be found in the following dashboard sections.
Agency Information
Agencies in Clarity
This Look contains a single value visualization of the current count of agencies that are in Clarity.
- Measures
-
- Count (Agencies)
- “Explore from Here”
- There are two ways to explore this Look to obtain more information.
- Select “Explore from Here”, then click on the count in the data section for a drill down containing Agency ID, Agency Name, CoC Code and Agency Status.
- This drill down Look can also be achieved by selecting the count of agencies on the dashboard tile.
- There are two ways to explore this Look to obtain more information.
Agency Detail
This Look contains a table visualization of agencies, county name, agency status and date added.
- Dimensions
-
- Agency Name
- County Name
- Agency Active?
- Added Date - Date
- “Explore from Here”
- Selecting “Explore from Here” will show the same table from the dashboard.
- Two drill down options are available.
- “By Programs Name”
- Select an Agency Name to produce a list of programs associated with the agency
- “By Added Time”
- Select an Added Date for a drill down of all agencies added on that date and the added time
- “By Programs Name”
- Two drill down options are available.
- Selecting “Explore from Here” will show the same table from the dashboard.

Program Information
Programs in Clarity
This Look contains a single value visualization of the current programs in Clarity.
- Measures
-
- Programs - Count
- “Explore from Here”
- There are two ways to explore this Look to obtain more information.
- Select “Explore from Here”, then click on the count in the data section for a drill down containing Program ID, Program Name, Project Type, Program Status, Agency Name and Agency ID.
- This drill down Look can also be achieved by selecting the count of agencies on the dashboard tile.
- There are two ways to explore this Look to obtain more information.

Programs by Project Type
This Look contains a column visualization of the current project type counts in Clarity.
- Dimensions
-
- Programs - Project Type Code
- Measures
-
- Programs - Count
- “Explore from Here”
- For more information, select any Programs Count for a drill down containing the Program ID, Name, Project Type Code, Program Active, Agency Name and Agency ID for the associated Project Type Code.

User Information
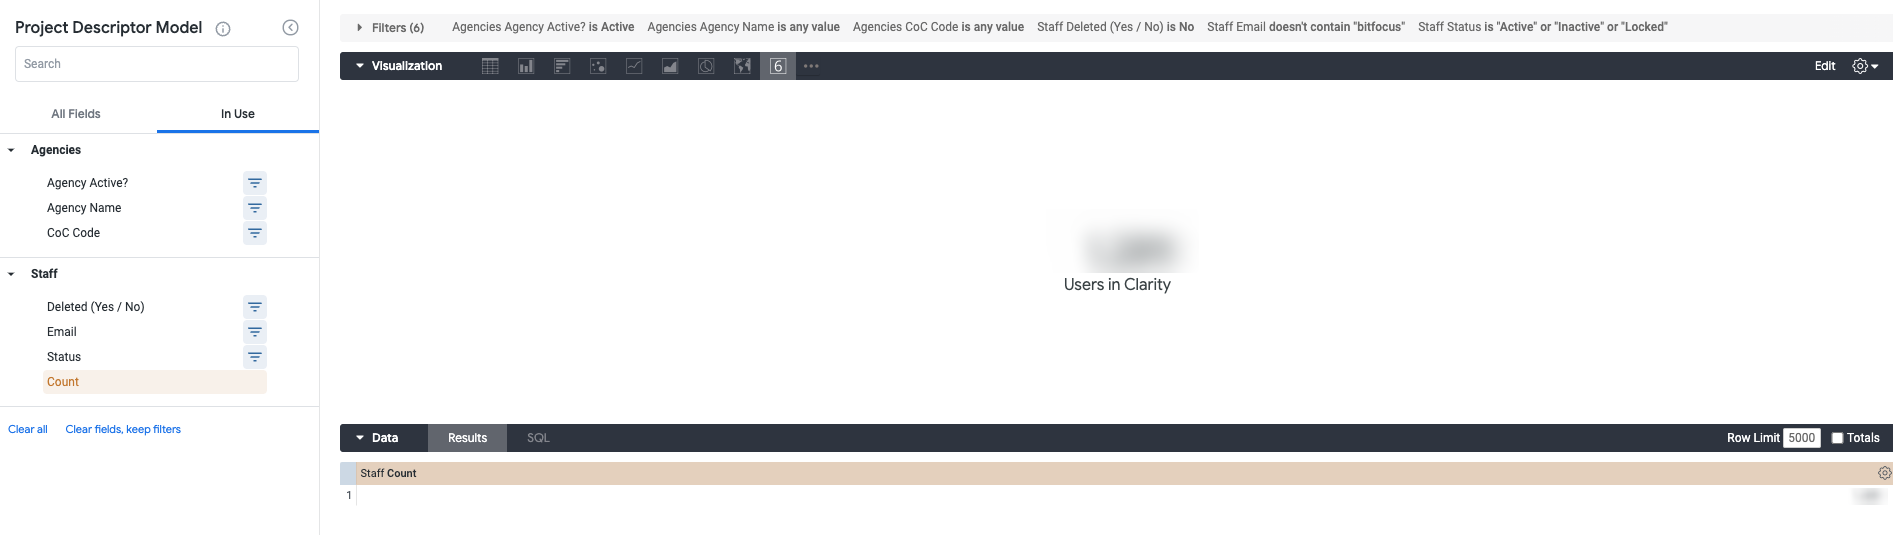
Users in Clarity
This Look contains a single value visualization of the current count of users that are in Clarity.
- Measures
-
- Staff - Count
- “Explore from Here”
- There are two ways to explore this Look to obtain more information.
-
-
- Select “Explore from Here”, then click on the count in the data section for a drill down containing User ID, First Name, Last Name, and Status.
- This drill down Look can also be achieved by selecting the value on the dashboard tile.
- Note: If the row limit is reached, download results for a complete list of users.
-
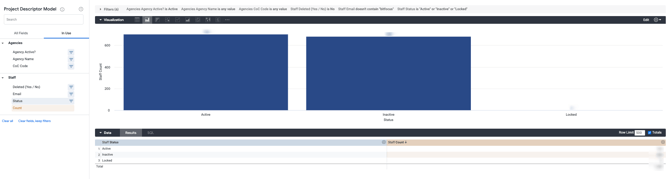
Staff Count by Status
This Look contains a column visualization containing counts of staff by status (active, inactive and locked).
- Dimensions
-
- Staff - Status
- Measures
-
- Staff - Count
- “Explore from Here”
- Selecting the values in the Staff Count column provides a drill down including User ID, First Name, Last Name and Status.
Primary Access Role Type
This Look contains a column visualization of the current primary access role type counts in Clarity. Each column is broken down by staff status.
- Dimensions
-
- Staff - Primary Access Role Type
- Staff - Status
- Measures
-
- Staff - Count
- “Explore from Here”
- Select any value in the Staff Count columns for a drill down containing the User ID, First Name, Last Name, and Status.

Access Role Count
This Look contains a table with access role information and counts broken down by staff status.
- Dimensions
-
- Staff - Primary Access Role - Name
- Staff - Status
- Measures
-
- Staff - Count
- “Explore from Here”
- Select any value in the Staff Count columns for a drill down containing the User ID, First Name, Last Name, and Status.

Screens Information
Screens in Clarity
This Look contains a single value visualization of the current count of screens in Clarity.
- Measures
-
- Screens - Count
- “Explore from Here”
- There are two ways to explore this Look to obtain more information.
- Select “Explore from Here”, then click on the count in the data section for a drill down containing Assessment ID, Assessment Name and Type.
- This drill down Look can also be achieved by selecting the value on the dashboard tile.
- There are two ways to explore this Look to obtain more information.

Screen Type
This Look contains a column visualization of the current screen type counts in Clarity.
- Dimensions
-
- Screens - Type
- Measures
-
- Screens - Count
- “Explore from Here”
- Select any value in the Screens Count column for a table containing the Assessment ID, Assessment Name and Type.

Template Information
Templates in Clarity
This Look contains a single value visualization of the current count of templates in Clarity.
- Custom Fields
-
- Count of Template Name
- “Explore from Here”
- There are no drill downs available for this Look.

Template & Program Count
This Look contains a table of the current templates in Clarity and a count of the programs utilizing them.
- Dimensions
-
- Programs - Template Name
- Measures
-
- Programs - Count
- “Explore from Here”
- Select any value in the Programs Count column for a drill down containing Program ID, Name, Project Type Code, Program Active, Agency Name and Agency ID for the associated Project Type Code.

Services Information
Services - Service Category, Service & Service Item Count
This Look contains a multiple values visualization with counts for unique service categories, service IDs and service item IDs.
- Custom Fields
-
- Count of Service Category
- Count of Service ID
- Count of Service Item ID
- “Explore from Here”
- There are no drill downs available for this Look.

Services by Category
This Look contains a table with Service ID and Service Item ID counts per Service Category.
- Dimensions
-
- Service Category
- Custom Fields
-
- Count of Service ID
- Count of Service Item ID
- “Explore from Here”
- There are no drills available for this Look.

Current Bed and Unit Inventory Information
Active Bed and Unit Counts by Project Type
This Look contains a grouped column visualization with counts of current, available bed and unit inventory broken down by project type.
- Dimensions
-
- Project Type Code
- Measures
-
- Total Bed Inventory - Bed and Unit Inventory
- Total Unit Inventory - Bed and Unit Inventory
- Custom Filter
${program_inventory.start_month}<=now()
AND (${program_inventory.end_date}>now()
OR is_null(${program_inventory.end_date}))
- “Explore from Here”
- Select any value from the Total Inventory columns for a drill down containing Agency ID, Agency Name, Program ID, Program Name, Bed Inventory ID, Household Type, Availability Bed Type and Total Unit Inventory

Active Bed and Unit Inventory Detail
This Look contains a table with active bed and unit inventory information including Program Name, Project Type, Household Type, Start Date, End Date and Total Unit and Bed Inventory Counts.
- Dimensions
-
- Program Name
- Project Type
- Household Type - Bed and Unit Inventory
- Start Date - Bed and Unit Inventory
- End Date - Bed and Unit Inventory
- Measures
-
- Total Bed Inventory - Bed Allocations
- Total Unit Inventory - Bed Allocations
- “Explore from Here”
- Selecting values from the Total Bed Inventory or Total Unit Inventory columns provides a drill down for the selected row with Agency ID, Agency Name, Program ID, Program Name, Bed Inventory ID, Household Type, Availability Bed Type and Total Unit Inventory.
- Selecting a value from the totals row provides a list with Agency ID, Agency Name, Program ID, Program Name, Bed Inventory ID, Household Type, Availability Bed Type and Total Unit Inventory for all applicable inventories.

Sharing Settings
Agency Sharing Settings
This Look contains a table with Agency Name and Sharing Settings (Agency Level Settings - Clients, Group - Clients, Files, Location, Messages and Services)
- Dimensions
-
- Agency Name
- Agency - Clients
- Agency Group - Clients
- Agency Group - Files
- Agency Group - Location
- Agency Group - Messages
- Agency Group - Services
- “Explore from Here”
- There are no drill downs available for this Look.

Community Queue Information
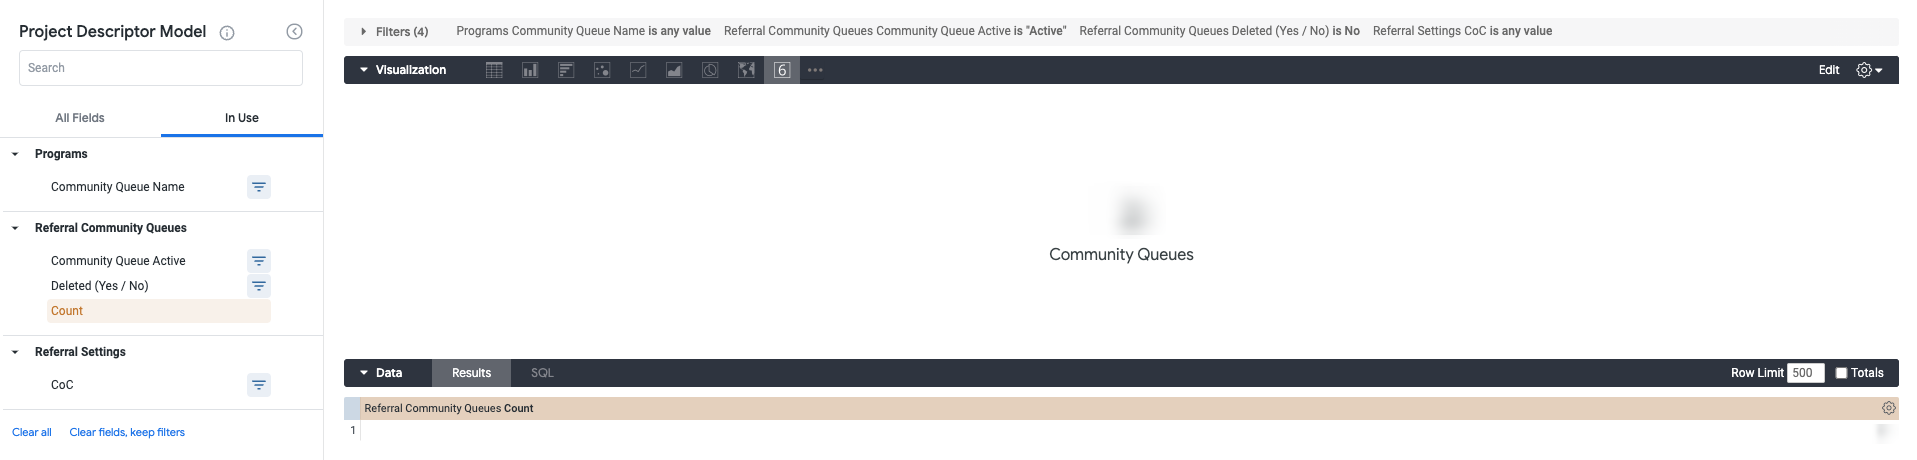
Community Queues in Clarity
This Look contains a single value visualization of the active Community Queues in Clarity.
- Measures
-
- Referral Community Queues - Count
- “Explore from Here”
- There are two ways to explore this Look to obtain more information.
- Select “Explore from Here”, then click on the count in the data section for a drill down containing Community Queue ID, Community Queue Name, and Default Community Queue.
- This drill down Look can also be achieved by selecting the count of agencies on the dashboard tile.
- There are two ways to explore this Look to obtain more information.
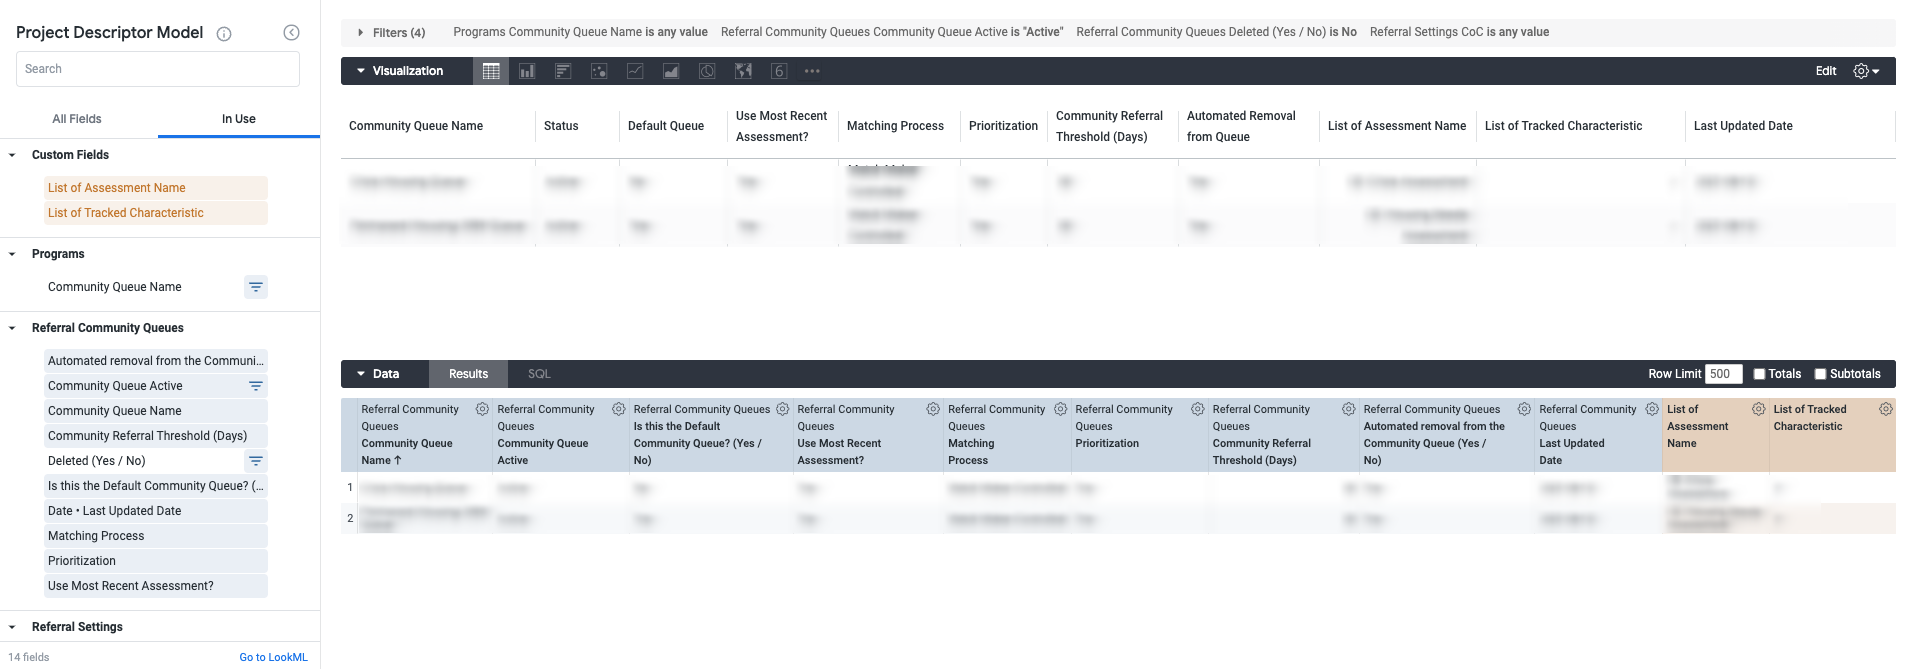
Community Queue Detail
This Look contains a table with Community Queue details including Community Queue Name, Community Queue Status, Default Community Queue, Most Recent Assessment, Matching Process, Prioritization, Community Referral Threshold (days), Automated Removal from Community Queue, Last Updated Date, and a list of assessments and tracked characteristics.
- Dimensions
-
- Community Queue Name
- Community Queue Active
- Is this the Default Community Queue? (Yes/No)
- Use Most Recent Assessment?
- Matching Process
- Prioritization
- Community Referral Threshold (Days)
- Automated Removal from Community Queue (Yes/No)
- Last Updated Date
- Custom Fields
-
- List of Assessment Name
- List of Tracked Characteristic
- “Explore from Here”
- There are no drill downs available for this Look.
CE Assessment Information
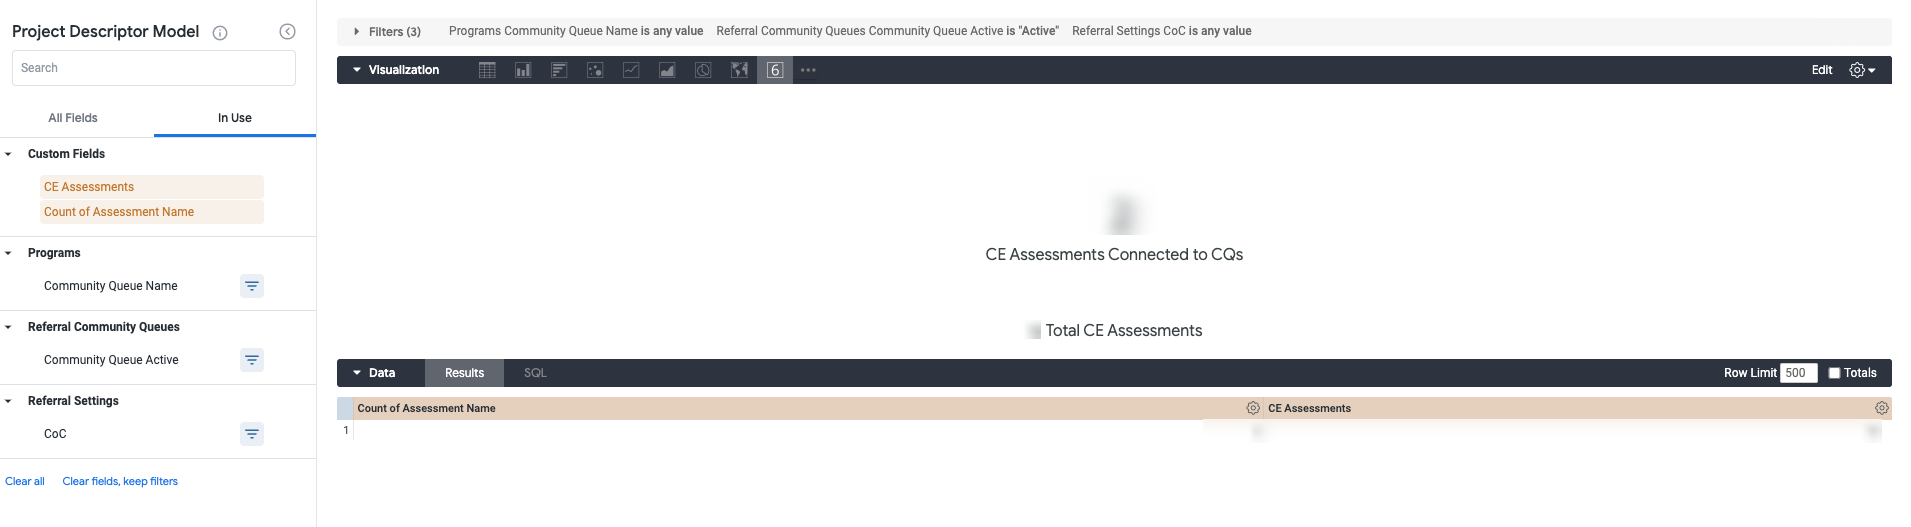
CE Assessments Connected to CQs
This Look contains a single value visualization with a count of CE assessments connected to Community Queues as well as a comparison below with a count of all CE assessments.
- Custom Fields
-
- Count of CE Assessments
- Count of Assessment Name
- “Explore from Here”
- Select the value in the CE Assessments column for a drill down containing Assessment ID, Assessment Name and Type.
 CE Assessing Program -> CE Assessments -> Community Queue Flow
This Looks is a merged query with a Sankey visualization depicting the flow from assessing program to assessment to community queue. Queries are merged by the assessment name dimension.
|
Primary Look |
Secondary Look |
Dimensions
Measures
|
Dimensions
|
- “Explore from Here”
-
- When “Explore from Here” is selected, the merged results will appear. The drill down available in the count column displays Assessment ID, Assessment Name and Type.
Merged Results Look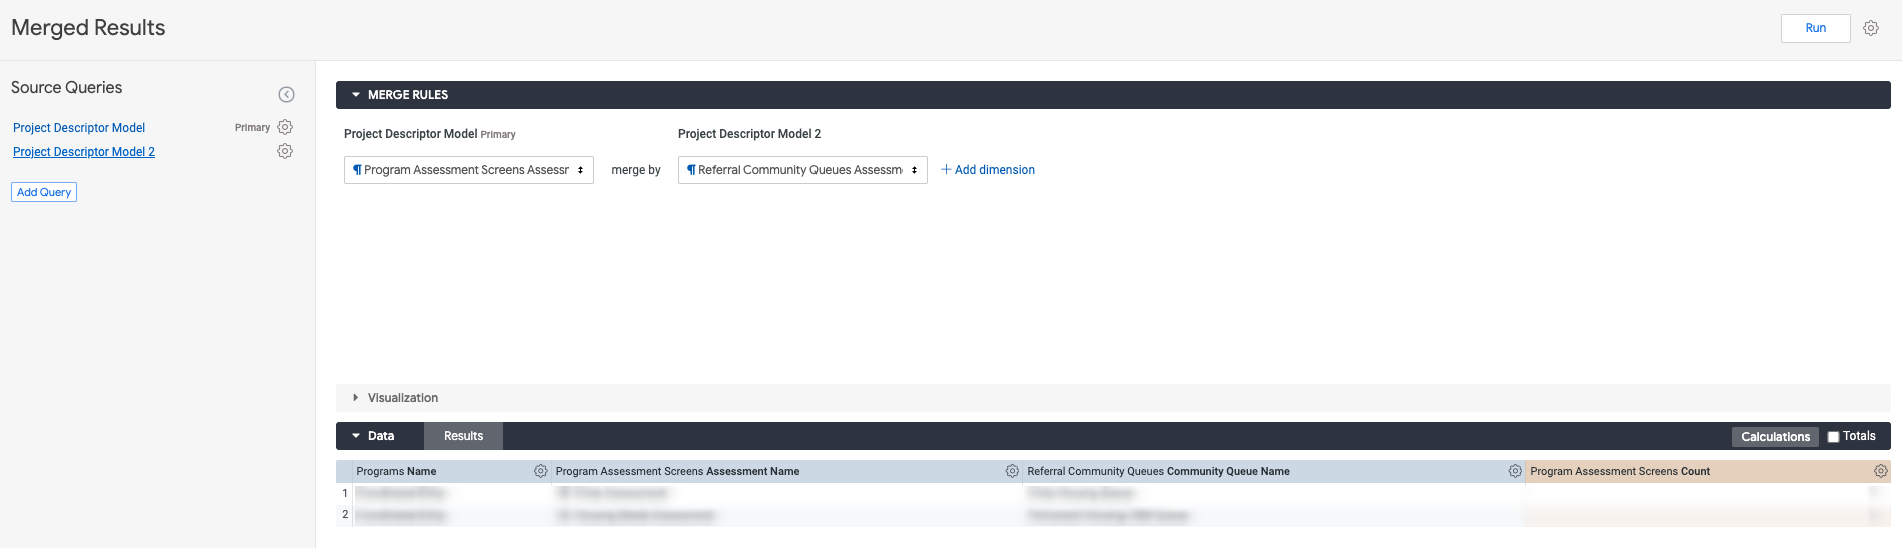
Primary Look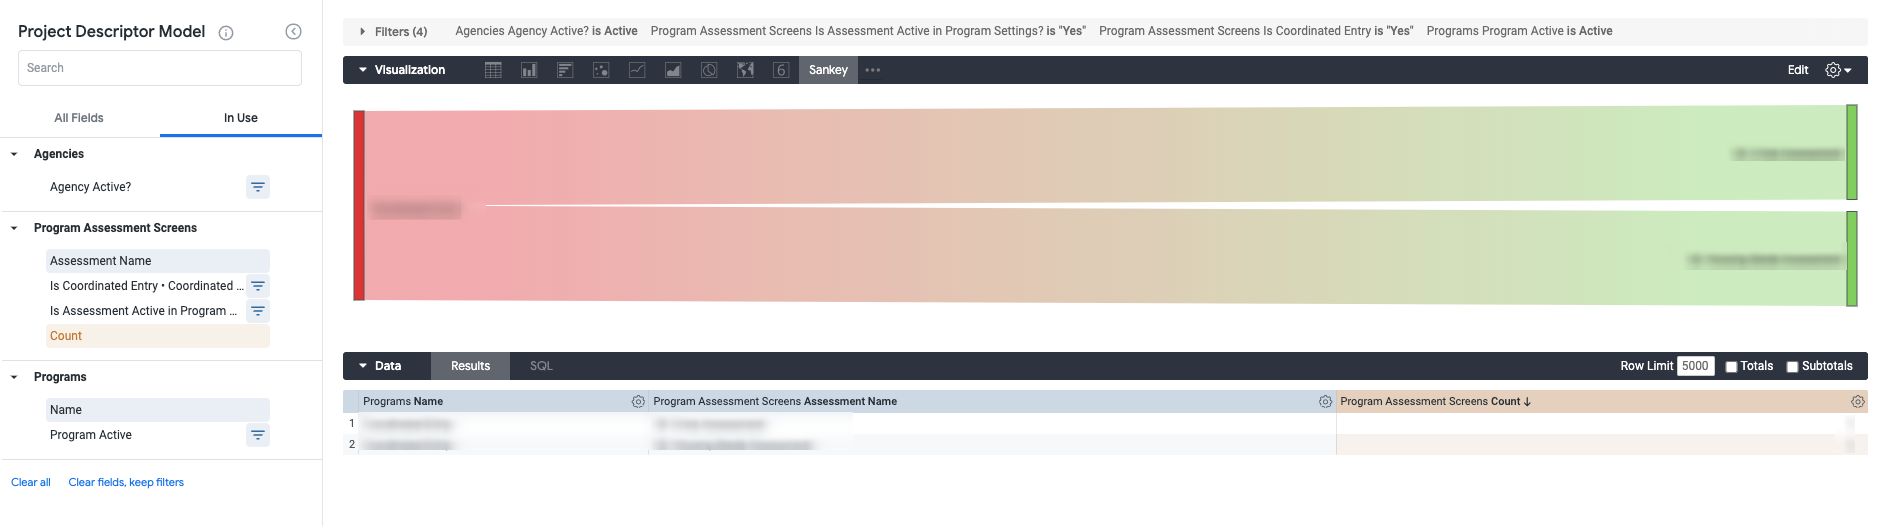
Secondary Look 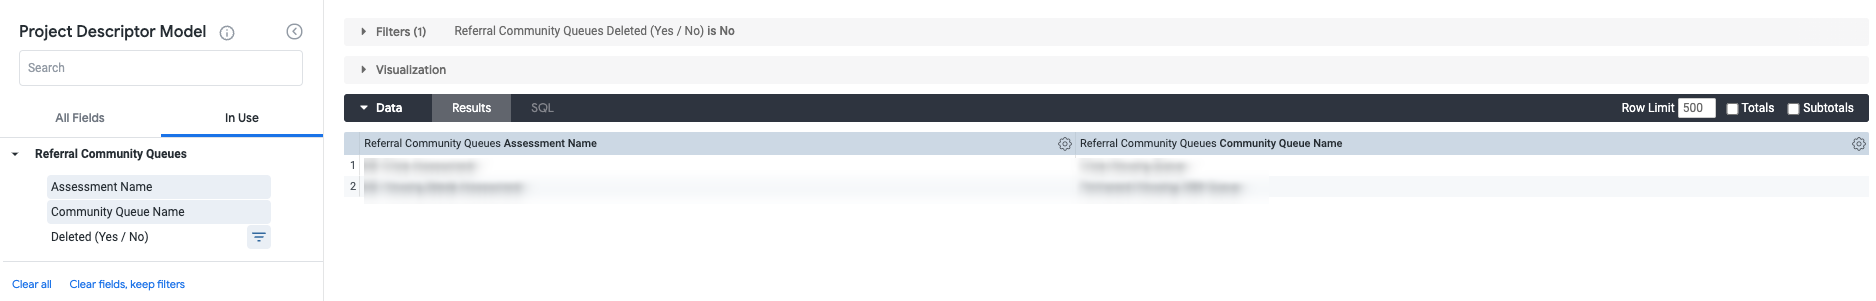
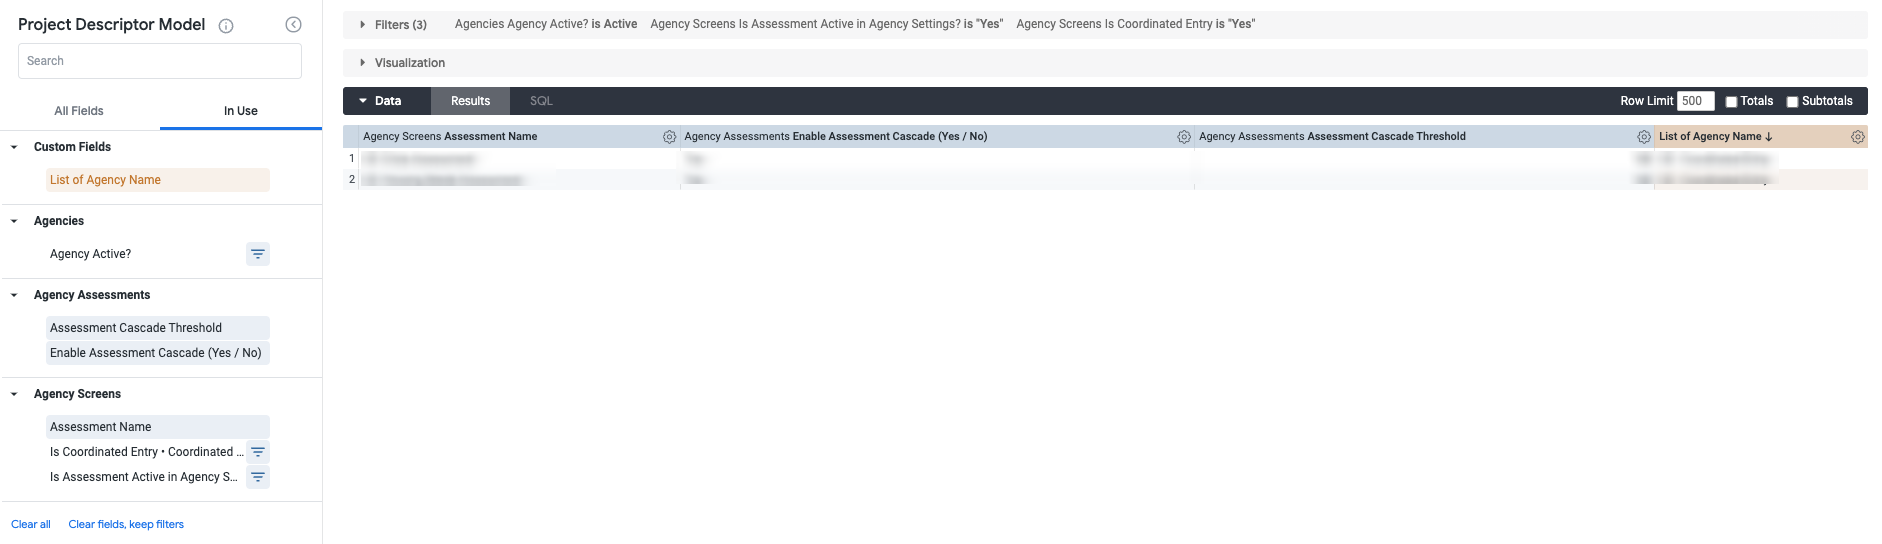
Assessment Details
This Looks is a merged query with a table visualization with coordinated entry assessment details. There are 3 queries that are merged by Screens Assessment Name and Agency Screens Assessment Name, and Screens Assessment Name and Program Assessment Screens Assessment Name. This table contains Assessment Name, Is Coordinated entry (Yes/No), Status, Eligibility Engine (yes/No), Last Updated Date, Enable Assessment Cascade (Yes/No), Assessment Cascade Threshold (days), and List of Program Names.
|
Primary Look |
Secondary Look |
Tertiary Look |
Dimensions
|
Dimensions
|
Dimensions
|
- “Explore from Here”
- When “Explore from Here” is selected, the merged results will appear. There are no drill downs available but when selecting List of Agency Names or List of Program Name, the associated Look will load (List of Agency Names - Tertiary Look; List of Program Names - Secondary Look).
Merged Results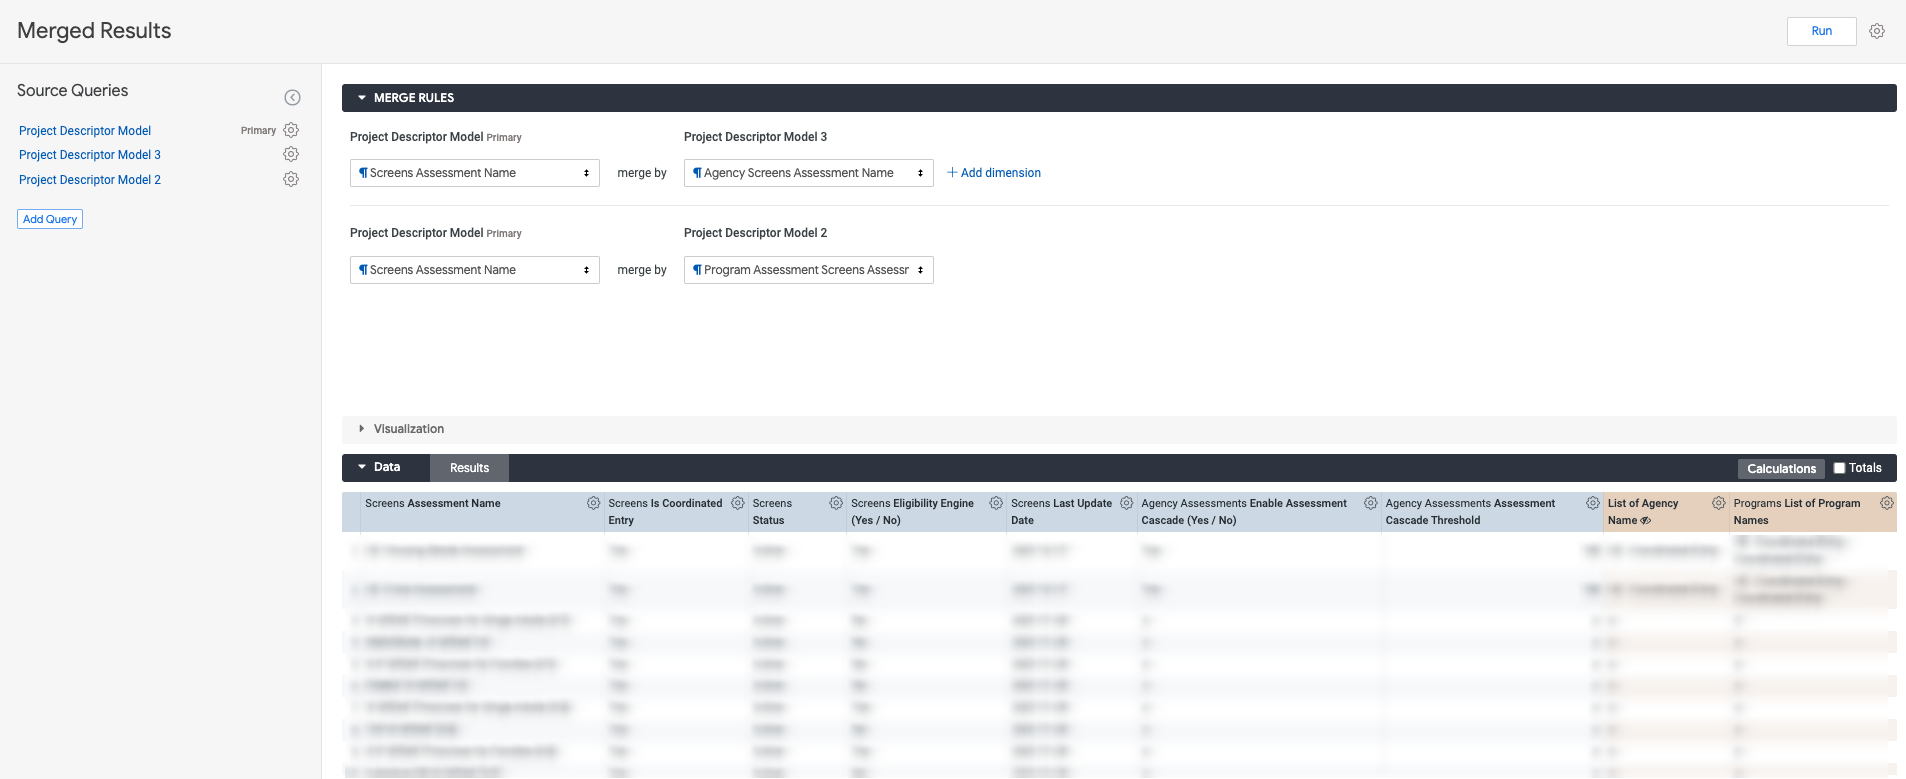
Primary Look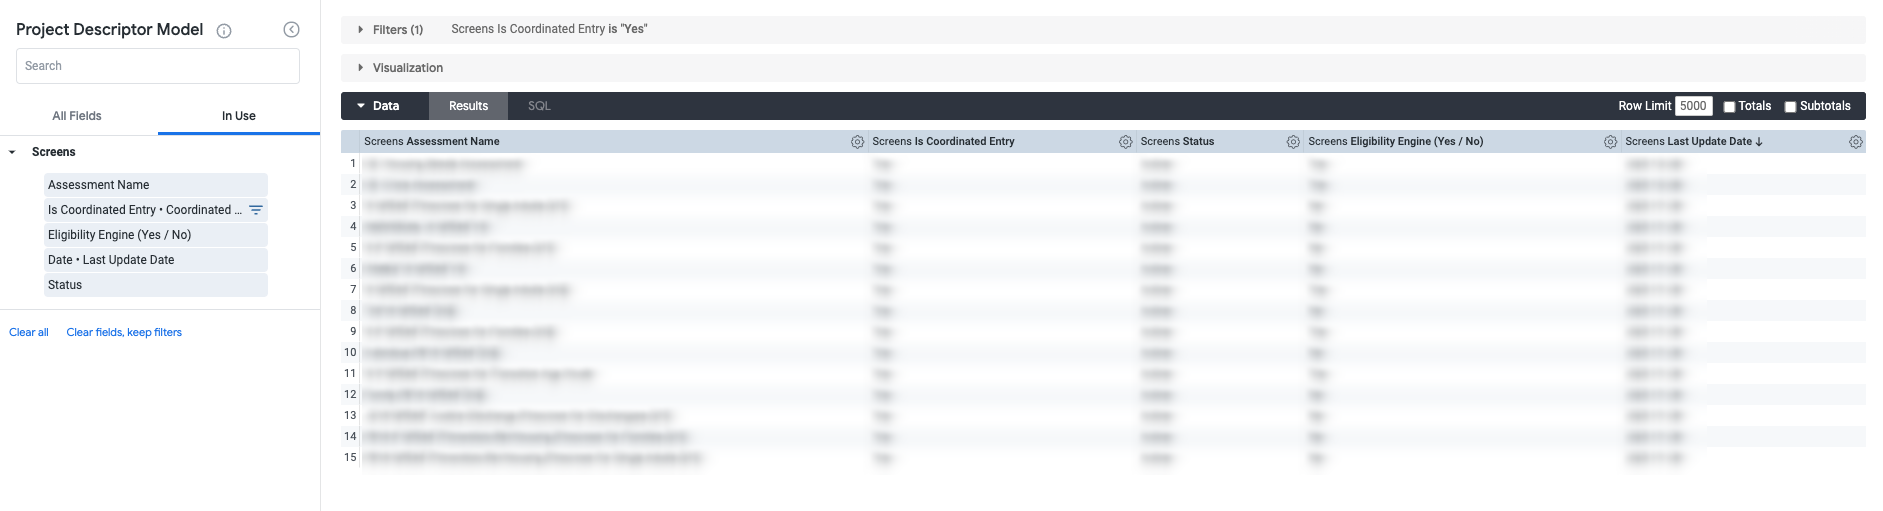
Secondary Look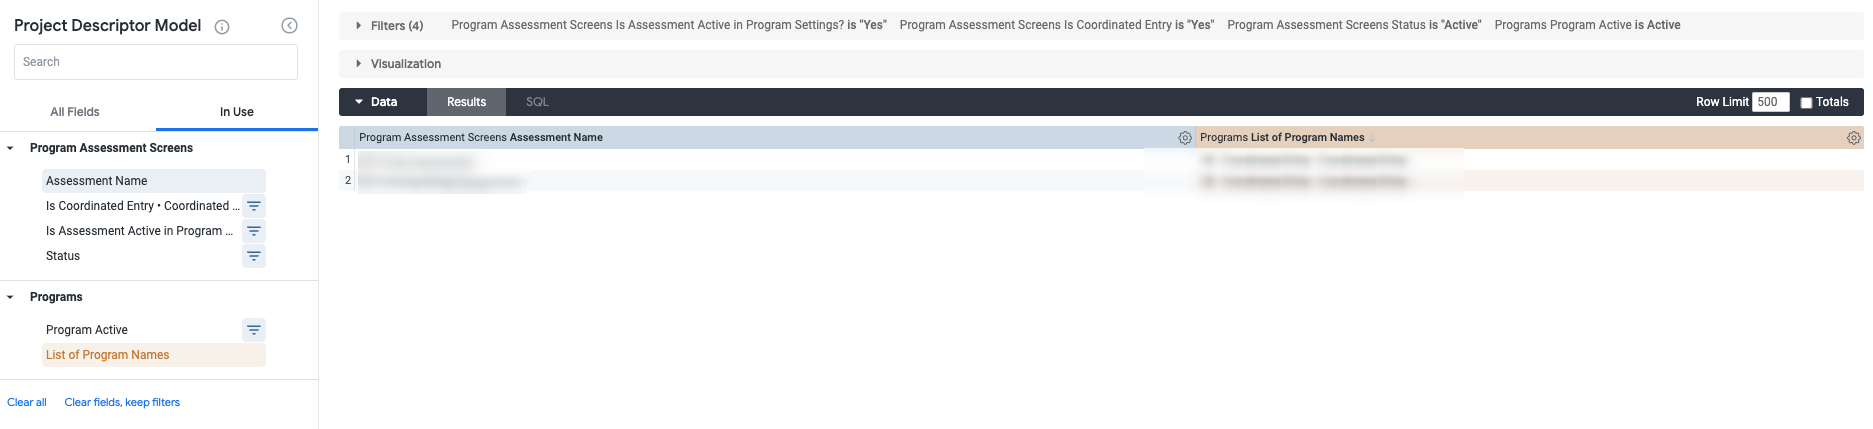
Tertiary Look