
This article is for the New Clarity Interface. Screenshots and descriptions will be updated as features are released. For the current interface article, see How Do I Work with Program Charts?
Table of Contents
- Overview
- Accessing the Charts Tab
- Line Charts for Numeric and Dollar Fields
- Fixed Category Strip Charts for Picklist and Checkbox Fields
- Understanding Assessment Data Point Labels
- Empty States
Overview
Program Charts allow agencies to track and graphically display changes in certain data over time in the client record. When data is collected at specific points in time during program enrollment, the Program Chart measures the selected data fields to track changes over time.
The System Admin or Agency Manager selects the fields and screens from which the system pulls data to build the chart. Please review the Program Setup: Charts article for more information on this process.
Accessing the Charts Tab
Users can view chart data from the Charts tab within a client's program enrollment. The Charts tab is positioned between the Files and Forms tabs in the enrollment tab order.
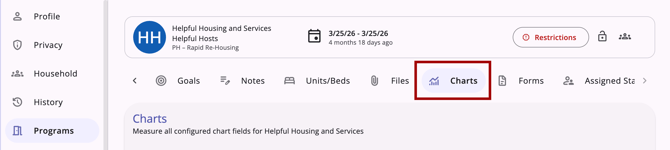
The Charts tab only displays when Charts is enabled for the program (i.e., the Program Charts toggle is turned on in the program's settings). If Charts is not enabled in the program, the tab is hidden and does not appear in the tab bar.
Users with standard access to client enrollments can view the Charts tab; no additional access role permissions are required.
Line Charts for Numeric and Dollar Fields
The Charts tab displays a time-series line chart of configured assessment field values plotted across the enrollment for numeric values. When at least one data point exists, a chart renders.
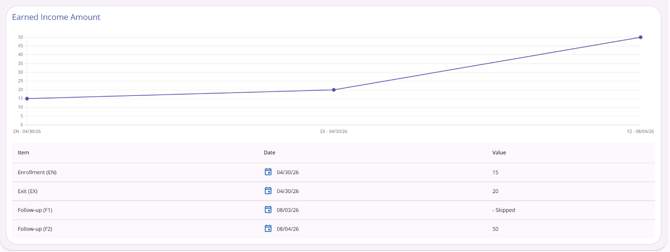
Chart fields with a Numeric or Dollar field type are plotted as a time-series line chart.
- Hovering over a data point shows a tooltip with the exact value.
- The X-axis represents assessment data collection points in chronological order by assessment date. See the Understanding Assessment Data Point Labels section below.
All completed assessment instances are plotted, not just the most recent of each type. For example, a client with three status assessments will show three separate data points (S1, S2, S3).
- If a field's value is blank for a given assessment instance, that data point is suppressed. It is neither plotted as zero nor shown on the chart.
- The chart is read-only. No add, edit, or delete actions are available.
Fixed Category Strip Charts for Picklist and Checkbox Fields
Chart fields with a Picklist or Checkbox field type are plotted as a fixed-category strip graph rather than a line chart. A legend at the top of the graph identifies each field value and its corresponding color.
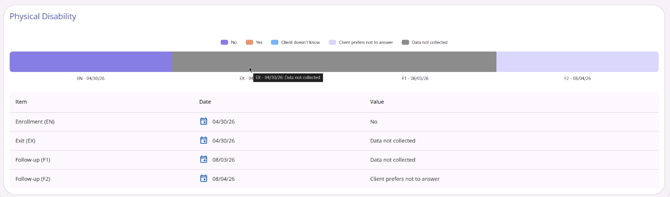
All completed assessment instances are shown, not just the most recent of each type.
- If a field's value for a given assessment instance is a blank Select placeholder (i.e., the picklist value is the default unselected state), that data point is suppressed. It is neither plotted as zero nor shown on the graph.
- If assessments have been completed but a chart field was never filled out, the graph for that field does not display, though historical data for other configured fields on those assessments still displays.
- The chart is read-only. No add, edit, or delete actions are available.
Understanding Assessment Data Point Labels
Each data point on the X-axis represents a data collection point in the program enrollment and is labeled with its assessment type code, in chronological order by assessment date:
- EN: Entry
- S(Number): Status assessment (for example, S1 is the first status assessment, S2 is the second, and so on)
- AN: Annual Assessment
- EX: Exit
- F(Number): Follow-up assessment (for example, F1 is the first follow-up assessment, F2 is the second, and so on)
- CU: Current Living Situation
Empty States
If Program Charts is enabled on the program setup, but no chart data is available yet, the standard empty state displays:
"No results yet!"
"Results will be displayed here when they are available."
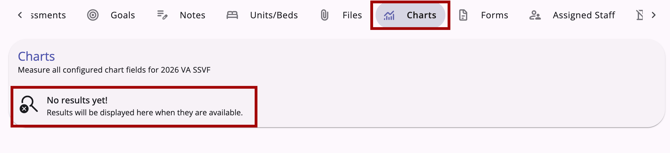
This same empty state indicates whether chart fields have not yet been configured for the program or are configured, but no assessment data points exist yet. The Charts tab does not distinguish between these two scenarios.
Published: 08/12/2026