Overview
Program Charts allow agencies to track and graphically display changes in certain data over time in the client record. When data is collected at specific points in time in the Program enrollment, the Program Chart measures the chosen data fields to track changes over time.
Using the Chart Tab
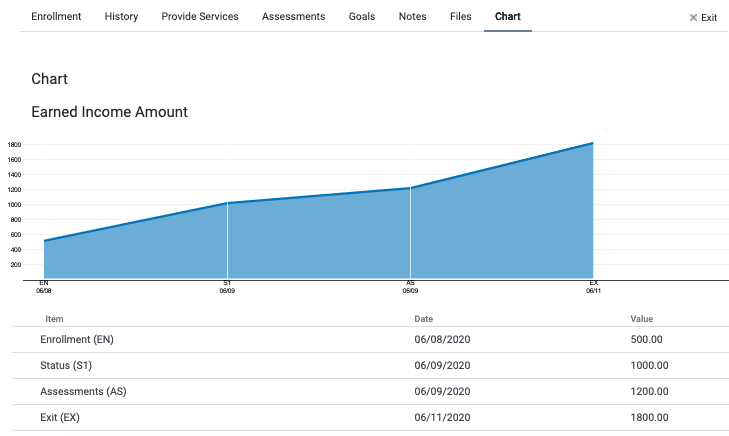
You can go to the Chart tab within the program enrollment to view the chart documenting the client's progress.
Your Agency Manager selects the fields and screens from which the system pulls data to build the chart. Please review the Program Setup: Charts article for more information on this process.
Each data point represents a data collection point in the Program enrollment:
- EN: Entry
- S(Number): Status (for example, S1 is the first status assessment, S2 is the second, and so on)
- AS: Annual Assessment
- EX: Exit
- F(Number): Follow-up (for example, F1 is the first follow-up assessment, F2 is the second, and so on)
Updated: 04/14/2025