[DQXX-106-AD] VI-SPDAT - Centralized Intake Dashboard Report
Type of Report
This is an assessment-based report specifically designed to work with VI-SPDAT assessments. Additionally, it is an administrator report and can be run across the entire Clarity instance.
Purpose of the Report
This dashboard report provides a VI-SPDAT assessment summary for the community.
Running the Report
Report Location
The report is found in the Administrator Report section of the Report Library.
Who Can Run the Report
Only System Administrators and others with the appropriate access roles may run the report.
Parameters
The following parameters are required to run this report.
| Parameter | Description |
| CoC |
Choose which CoC to include in the report |
| VI-SPDAT Processor | Choose which VI-SPDAT processor to include |
|
VI-SPDAT Assessment(s) |
Choose which assessment(s) to include:
|
| Report Date Range | Choose the Assessment Date range to include in the report |
| Report Output Format | Choose to format the report as a Web Page or PDF |
Report Details
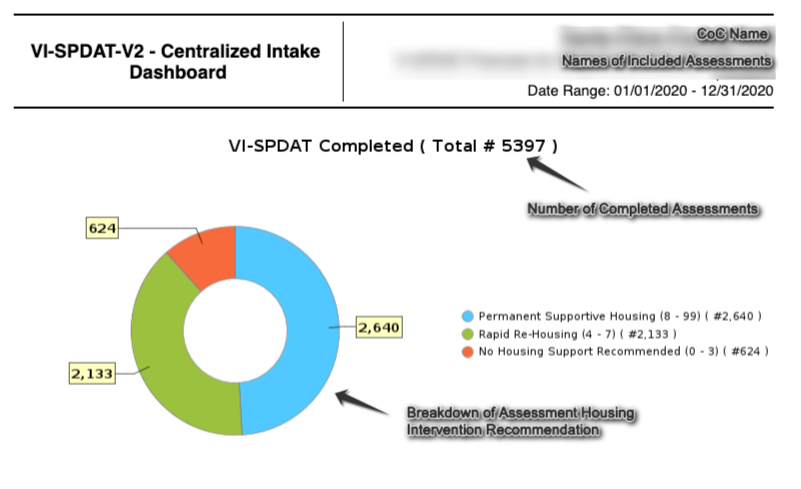
VI-SPDAT Completed
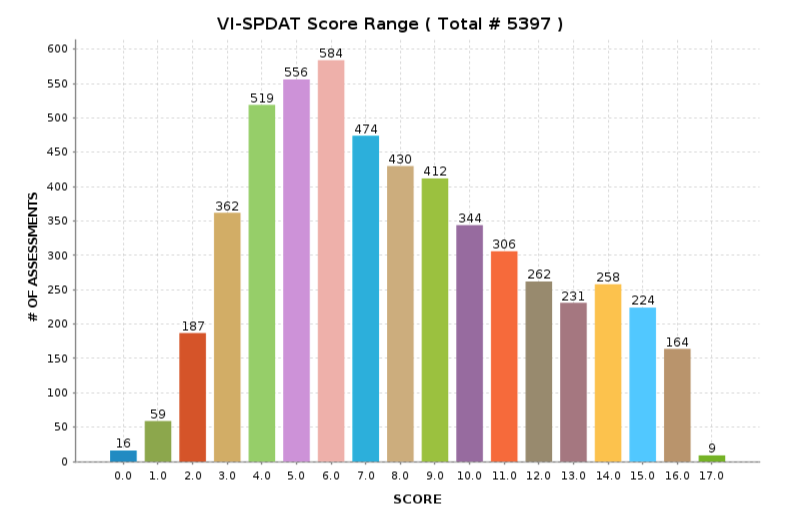
VI-SPDAT Score Range
This visual displays the number of assessments completed, by assessment score.
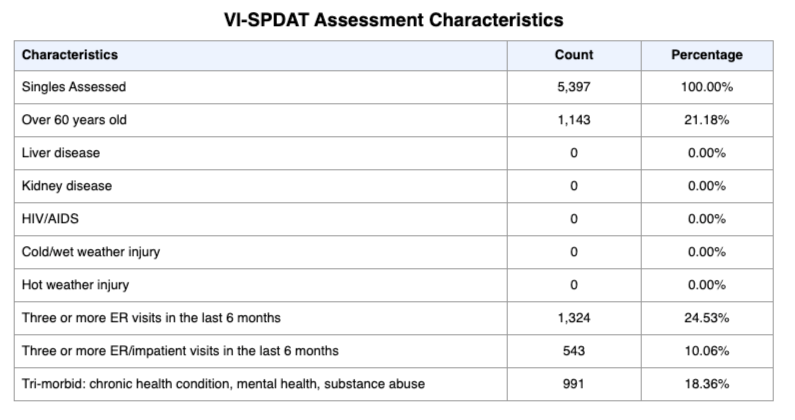
VI-SPDAT Assessment Characteristics
This table reports on the assessment of risk characteristics from the VI-SPDAT. The last row shows the number of assessments with "tri-morbidity", a critical factor in assessing for permanent housing assistance.
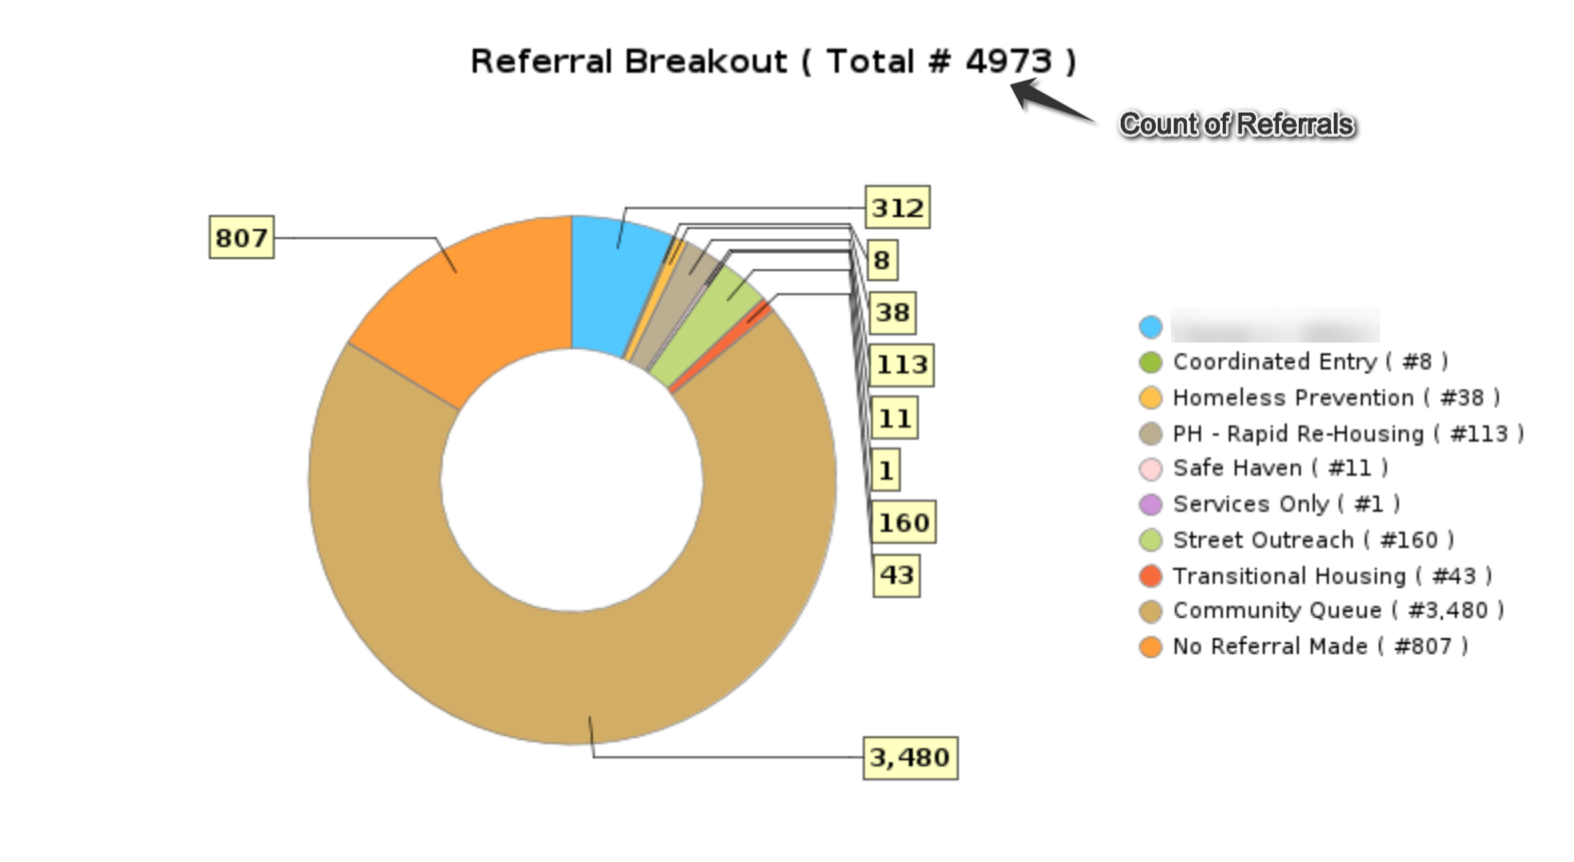
Referral Breakout
This pie chart displays the count of referrals by the referred to project type.
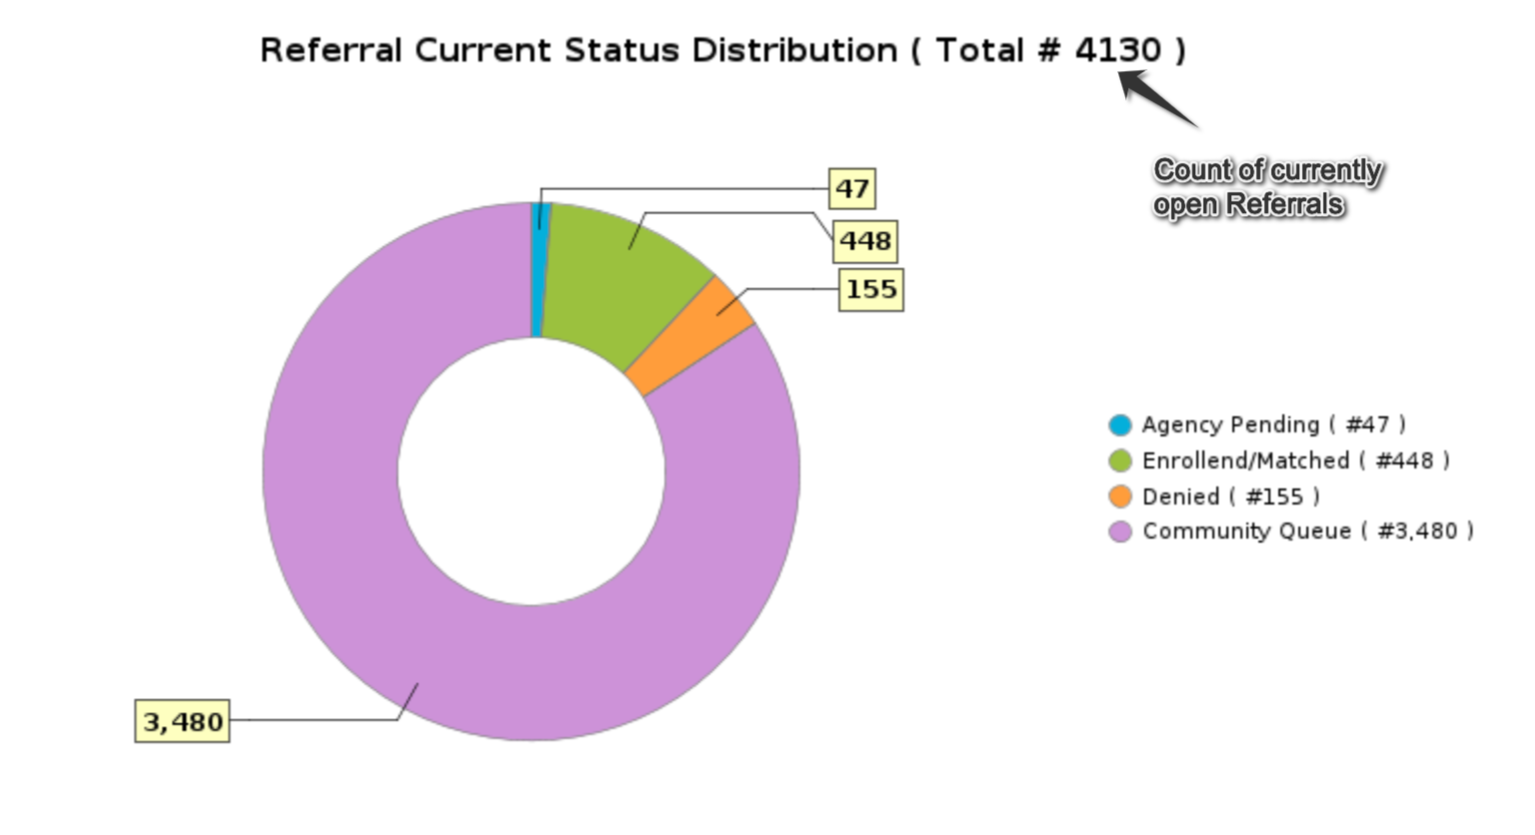
Referral Current Status Distribution
Displays the current status of open referrals.
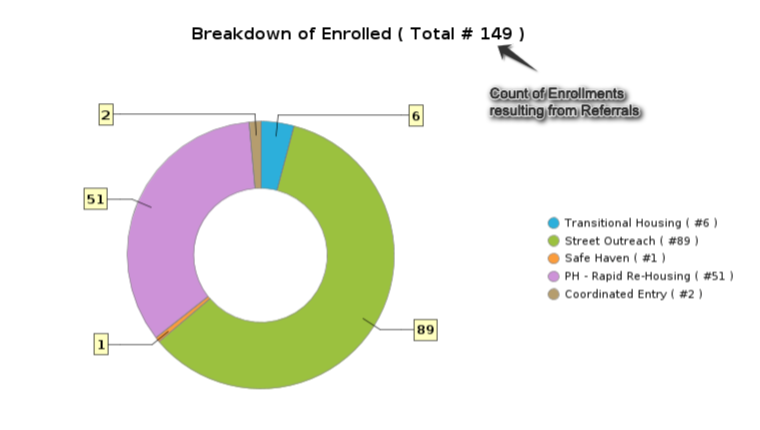
Breakdown of Enrolled
This chart displays the enrollments, by project type, resulting from referrals.
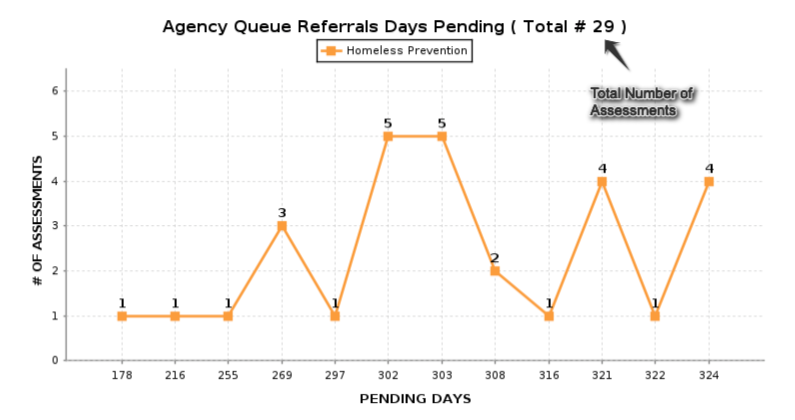
Agency Queue Referral Days Pending
The Referral Days Pending charts show how many days a referral has been pending in the Agency Queue. There is a separate chart for each referral project type.
Community Queue Referral Days Pending
Similar to the Agency Queue charts, the Community Queue Referrals Days Pending shows how long referrals remain on the Community Queue.
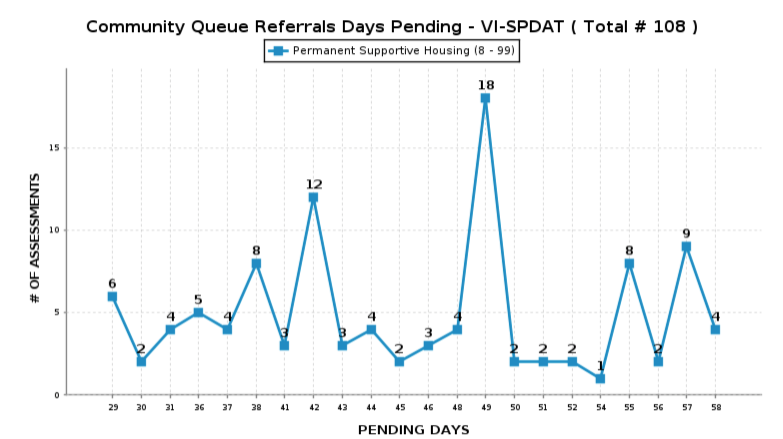
And like the Agency Queue charts, there are separate charts for each project type.
Updated 09/23/2021