Report Purpose & Summary
The Monthly Staff Report provides three categories of information:
- General data quality
- User Activity (including the number of clients, [both existing and new] that each staff member worked with during the time frame of report)
- Data quality by data element (e.g. Date of Birth, Race and Ethnicity, Veteran Status, etc.) for all clients served
The report also includes staff from other agencies with "additional access" to the reporting agency data. Staff are pulled into this report based on client's open program enrollments and assigned staff.
Running the Report
Who Can Run the Report
Anyone can run the report but the returned information will be limited based on the access rights of the user.
Report Location
This report can be found in the following location in the Report Library:
- Data Quality Reports → [DQXX-103] Monthly Staff Report
Parameters
The following parameters are required to run the report:
| Report Date Range | The range of activity dates to include in the report |
| Report Output Format |
Web Page, PDF, or Excel |
Report Details
General Data Quality
This report shows data quality for clients that are included in the report.

User Activity
User activity is broken into 4 sections:
- Active Staff
- Active Staff – No Activity
- Inactive Staff with Actively Enrolled Clients
- Locked Users with Activity

- Name: Lists the names of the users who have accessed the system within the report dates
- Unique Clients: Unique number of clients currently receiving service within the report date range
- New Clients: Unique number of clients newly enrolled in a service or program within the report date range
- Average Timeliness (in days): Average number of days from program/service start date to the time the service/program was recorded
- DQ % Doesn’t Know: Average percentage of Program Specific Data Elements answered "Client doesn’t know"
- DQ % PNTA: Average percentage of Program Specific Data Elements answered "Client prefers not to answer" (PNTA)
- DQ % Not Collected: Average percentage of Program Specific Data Elements answered "Data not collected" or is NULL
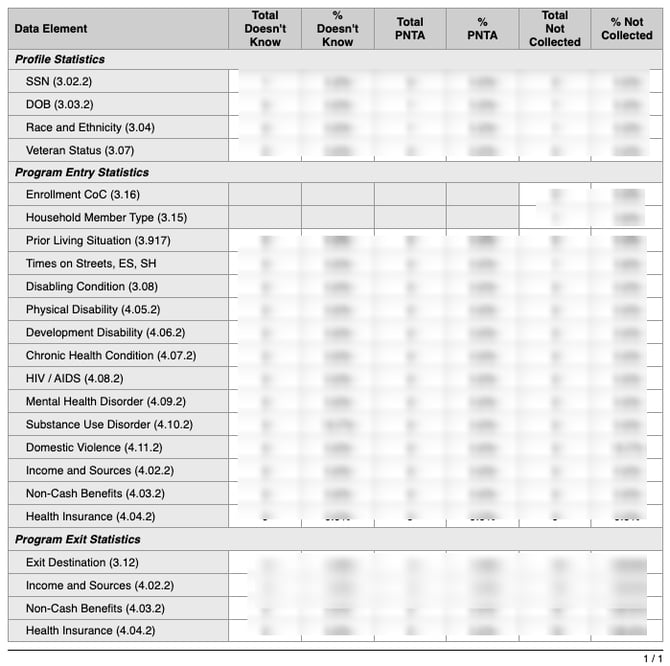
Data Element
The data in this chart returns the data quality error statistics for each of the data elements. The errors are pulled from the screens as indicated by the section headers.
The chart provides the amount and percentage of "Client doesn’t know," "Client prefers not to answer" (PNTA), and "Data not collected"/NULL response options for all clients served during the report period.
Drilldown Functionality
Drilldown functionality is provided for Unique Clients and New Clients columns for all sections except Active Staff - No Activity. Clicking on the counts in the Unique Clients and New Clients columns will return a list of clients with a table containing Unique Identifier, Name, SSN, and Date of Birth.
Drilldown functionality is also provided in the Data Element table. Clicking on one of the counts in the Total Doesn't Know, Total PNTA, or Total Not Collected column will return the following:
-
- Unique Identifier
- Name
- SSN
- Date of Birth
- Notes (for Total Not Collected only)
- Program Name
- Program Stay [Start Date - End Date])

Updated 10/01/2025