
Table of Contents
- Purpose
- Creating the Look
- Running and Saving the Look
- Formatting the Visualization
- Additional Resources
Purpose
The following instructions will generate a Look to help find the basic data quality problems reported in the Longitudinal System Analysis (LSA). The Look casts a wide net to surface common errors that need to be resolved. You are welcome to develop a more detailed report, but for this article, keeping it simple is the goal.
Creating the Look
Open the Data Quality Model in Explore.
Add the following fields to the Look:
|
Field |
|
Personal ID (Clients folder) |
|
Enrollment ID (DQ Client UDE) |
|
Client Location Error (DQ Client UDE) |
|
SSN Error (DQ Client UDE) |
|
DoB Error (DQ Client UDE) |
|
Gender Error (DQ Client UDE) |
|
Race and Ethnicity Error (DQ Client UDE) |
|
Veteran Status Error (DQ Client UDE) |
|
Relationship to Head of Household Error (DQ Client UDE) |
|
Disabling Condition Error (DQ Client UDE) |
|
Domestic Violence Victim or Survivor Error (DQ Client Program Specific) |
|
Liv. Sit. A: Living Situation Error (DQ Client UDE) |
|
Liv. Sit. A: Length of Stay at Prior Place Error (DQ Client UDE) |
|
Liv. Sit. A: Approximate Date Homelessness Started Error (DQ Client UDE) |
|
Liv. Sit. A: Number of Occurrences Client has been in Homeless Situation Error (DQ Client UDE) |
|
Liv. Sit. A: Months Homeless (DQ Client UDE) |
|
Liv. Sit. B: Living Situation Error (DQ Client UDE) |
|
Liv. Sit. B: Length of Stay at Prior Place Error (DQ Client UDE) |
|
Liv. Sit. B: Approximate Date Homelessness Started Error (DQ Client UDE) |
|
Liv. Sit. B: Number of Occurrences Client has been in Homeless Situation Error (DQ Client UDE) |
|
Liv. Sit. B: Months Homeless (DQ Client UDE) |
|
Exit Destination Error (DQ Client UDE) |
|
Housing Move In Date Error (DQ Client UDE) |
Note: Due to the collection methods for Living Situations type A and type B, it is necessary, at this time, to have two dimensions for each Living Situation field.
Adding Filters
Add or change the following filters:- Adjust the Reporting Period Filter to: "is in range" 2017-10-01 until (before) 2018-10-01
- For a second, deeper pass at correcting data, expand the range to 2015-10-01 - 2018-10-01
- Add CoC (Program CoC)
Set it equal to the appropriate CoC code - Add Project Type Code (Programs)
Set it equal to:- Emergency Shelter - Entry Exit
- Emergency Shelter - Night-by-Night
- PH - Housing Only
- PH - Housing with Services
- PH - Permanent Supportive Housing
- PH - Rapid Re-Housing
- Safe Haven
- Transitional Housing
- Add optional filters for Agency, Program, etc to narrow the scope of the report
Create a Custom Filter
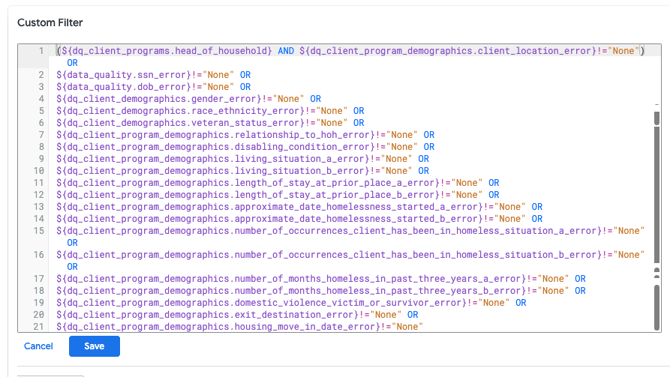
- The custom filter will narrow the results to only those clients/enrollments with LSA data quality problems
- Open the custom filter area:

- Open the text file attachment, LSADQCustomFilter.rtf, containing the logic for the custom filter (file also linked in the Additional Resources section)
- Copy all the text
- Paste the text into the custom filter area
Running and Saving the Look
- Run the Look
- Save the Look for future use
Formatting the Visualization
- Open the Visualization pane
- Click Edit to open the Edit window
- Turn Off "Show Full Field Name"
- Click on Edit again to close the Edit window
- Save again
Reviewing the Results
The visualization should look something like the following:
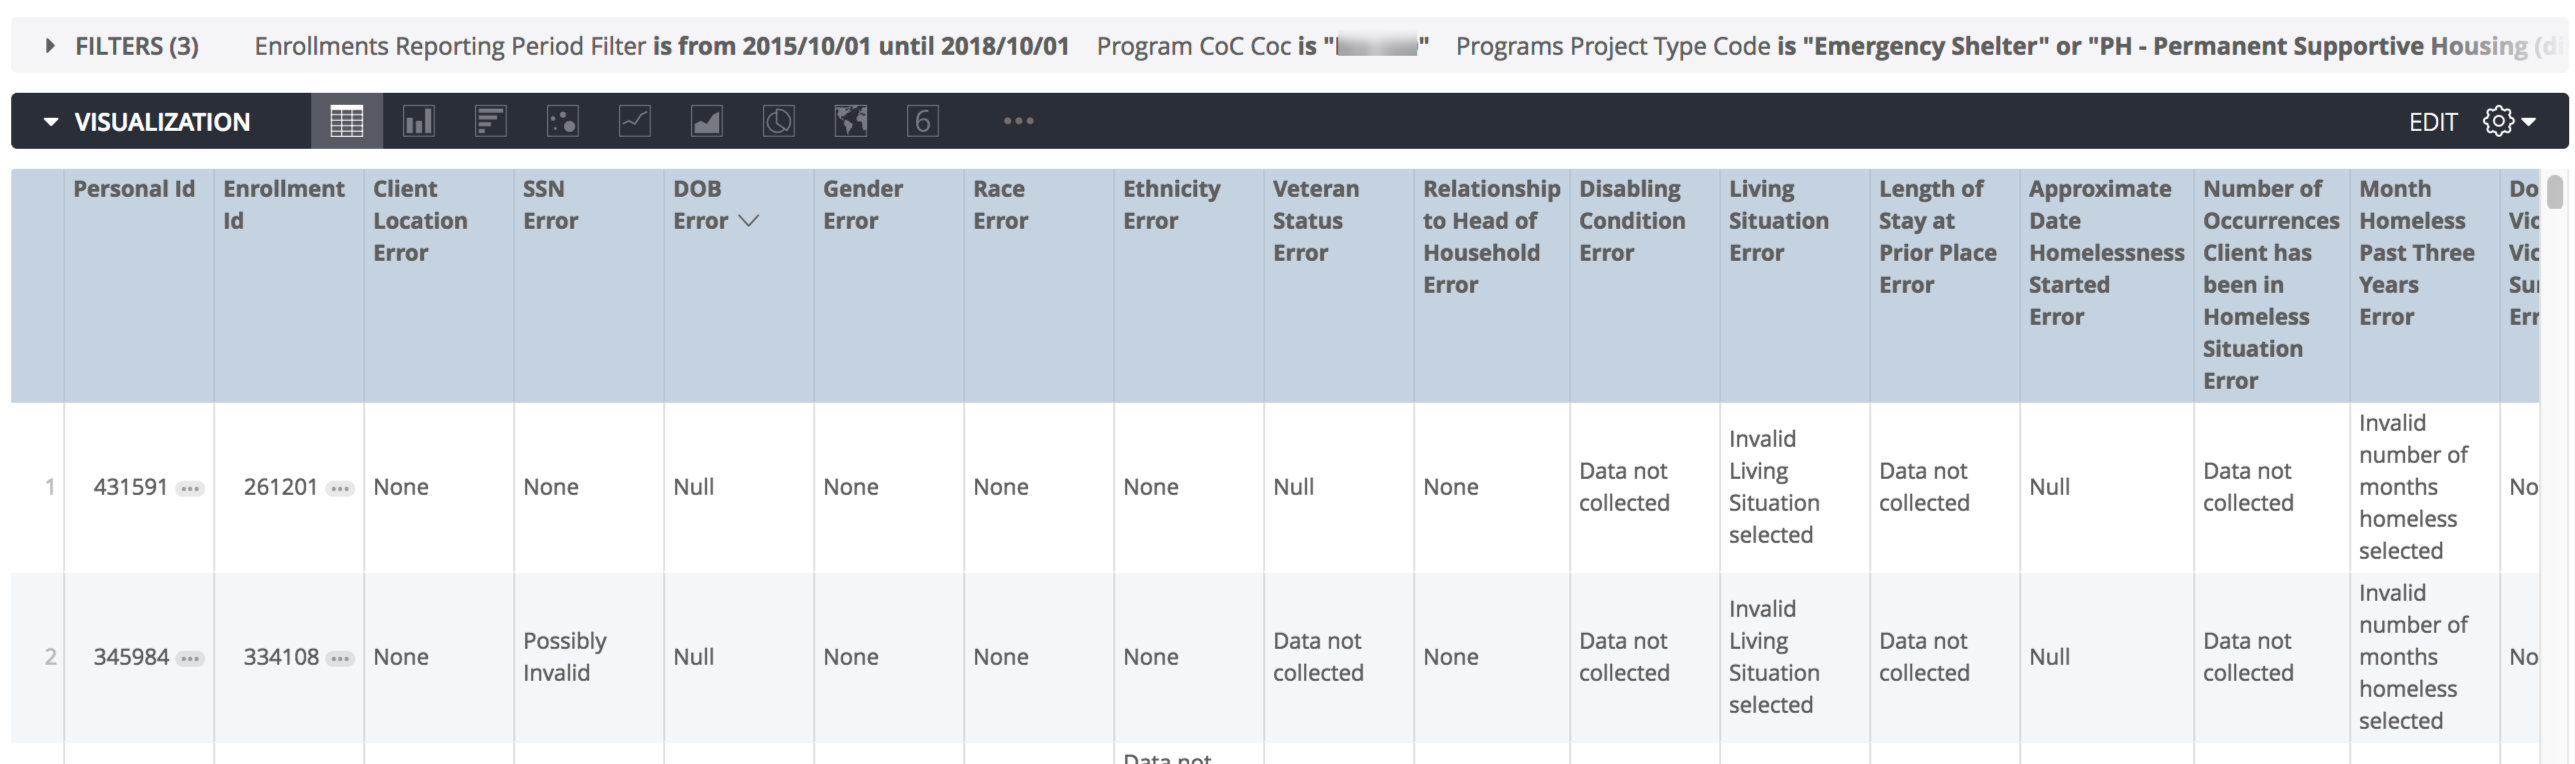
Each row reports on one client/enrollment with at least one data quality problem.
Additional Resources
- LSADQ Custom Filter.rtf
- Data Quality Model
- Longitudinal Systems Analysis (LSA) Tools and Guidance (HUD Exchange)
Updated: 10/13/2026