Custom Dimensions, Measures, and Table Calculations
While Bitfocus developers work to anticipate all needs for the data analysis tool, it is impossible to have fields that will meet all requirements for all reports. That's where Custom Dimensions, Measures, and Table Calculations come in.
The Basics
To create a custom field
- Scroll to the top of the field picker to Custom Fields, click New
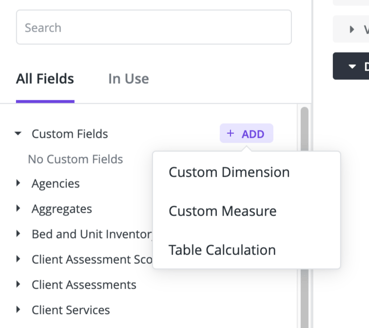
- Choose which type of field to add.
Note: When configuring Looks, please note that Filter Dependent fields are not compatible with filtered custom fields.
Useful Functions
For a more detail listing of available functions and operators, please consult Looker Functions and Operators.
Grouping Dimensions - if(any, yes, no)
These can be summarized as If_____, then _____, else _____. For example:
- If Exit Destination is Emergency Shelter, then Homeless, else Other
Here are a couple of examples using if(any, yes, no)
Disability Income
if(${entry_screen.income_ssdi_is}
OR ${entry_screen.income_ssi_is}
OR ${entry_screen.income_vet_disability_is},
"Disability Income", "Other Income")
Age Tiers
if(${entry_screen.age}<1,"Baby",
if(${entry_screen.age}<3,"Toddler",
if(${entry_screen.age}<5,"Preschool",
if(${entry_screen.age}<12,"Gradeschooler",
if(${entry_screen.age}<18,"Teen","Adult")))))
Pro Tip
Put the different dimensions in the order you want them checked. For instance, the different ages in the example above.
Using the latest screen - coalesce(Any, Any, ...)
One of the challenges of HMIS is the different screens used to collect the same data from customers. The following example uses the coalesce function to check various screens for non-NULL values.
Total Cash Income
As mentioned in the above Pro Tip, the order in the screens are placed in the formula matters.
coalesce(${followup_screen.income_change},${last_screen.income_individual},${status_update_screen.income_individual},${entry_screen.income_cash})
Table Calculations
For table calculations, all dimensions and measures used in the calculation must be included in the data table. The dimensions and measures may be hidden from the visualization.
For more details about using table calculations, please consult Using Table Calculations available from Looker.
For a full list of functions and operators, please consult Looker Functions and Operators.
Percent of Total
A simple place to start with Table Calculations is with Percent of Total.
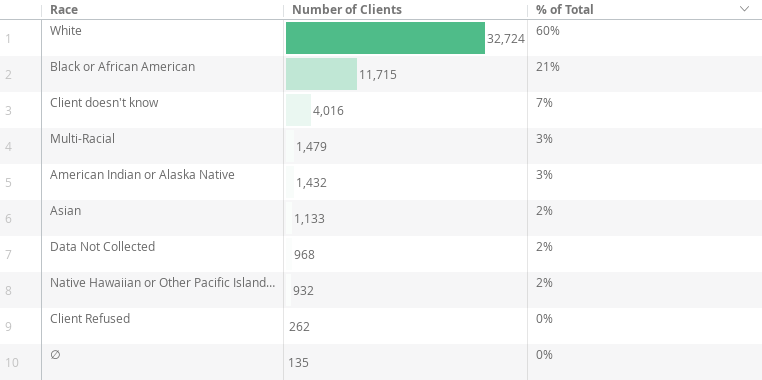
Strategy: [Number of Clients]/Sum[Number of Clients]
- Add the needed dimension and measure to the data table
- From Custom Fields, click New, Table Calculation
- Give the table calculation a name
- Complete the formula as shown below:
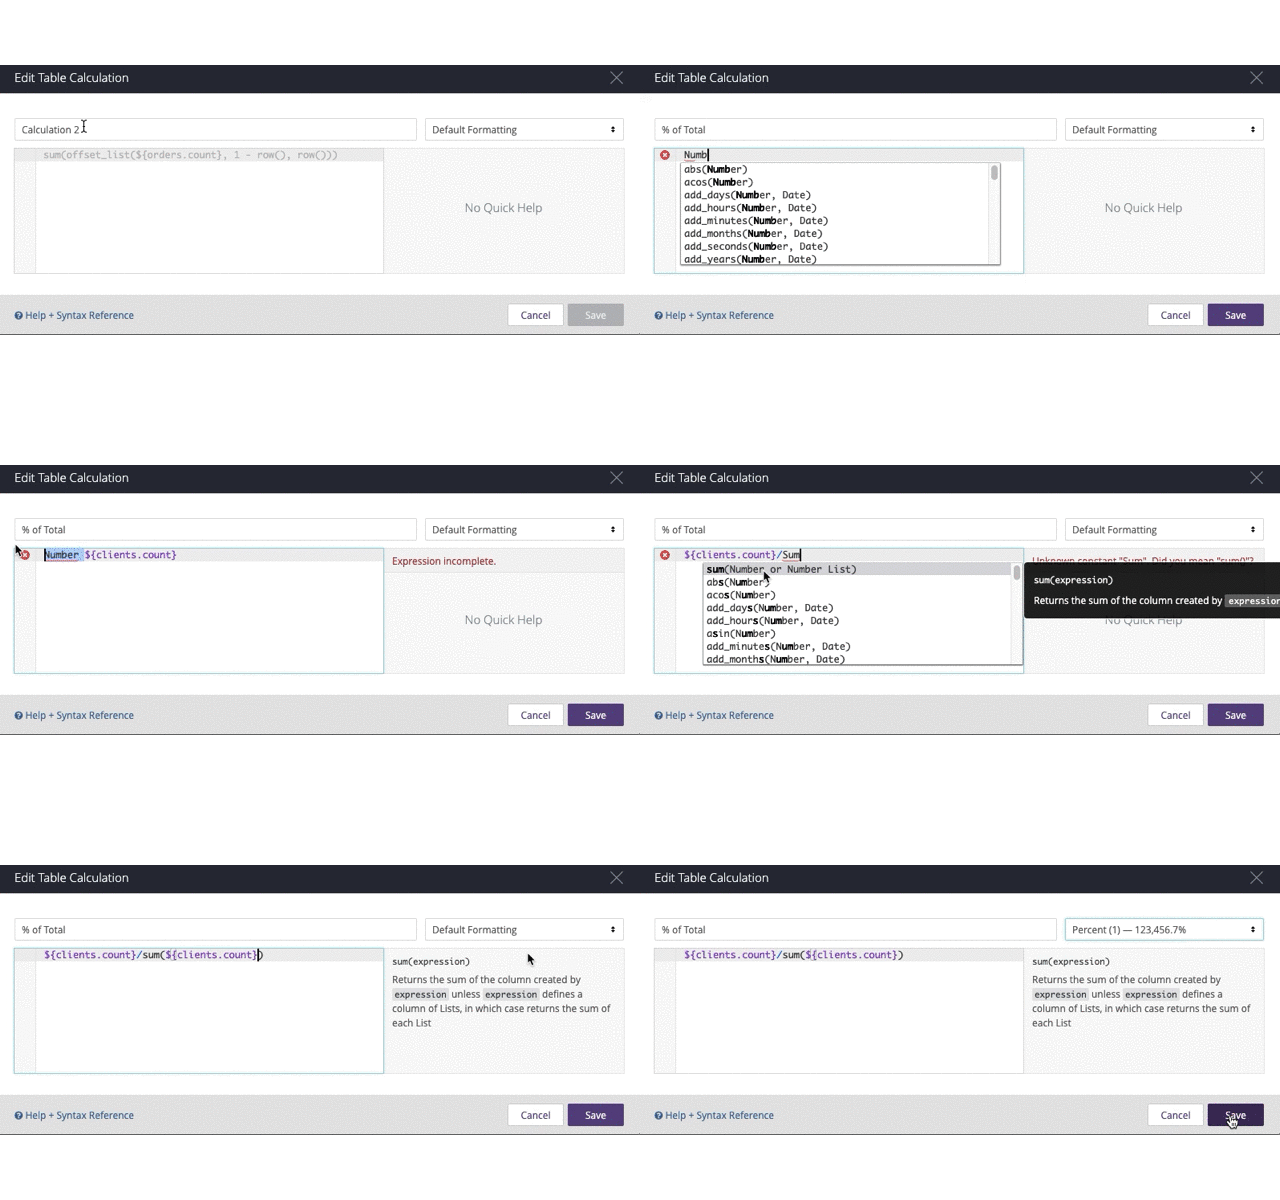
Shortcut: copy and paste the following:
- ${clients.count}/sum(${clients.count})
HUD Age
A second common calculation that can also be used in Custom Dimensions (see below) is calculating HUD Age. The below calculation is for adults.
diff_years(${clients.birth_date},if(${enrollments.start_date}>=${enrollments.reporting_period_start_date},${enrollments.start_date},${enrollments.reporting_period_start_date}))>17
Custom Dimensions
One of the most common ways to use custom dimensions would be to group responses. For example, it may be desirable to group responses:
- Client Prefers Not to Answer
- Client Doesn't Know
- Data Not Collected
- NULL
Unlike table calculations, custom dimensions do not require dimensions and measures included in the custom dimension to be included in the data table.
For more examples of available custom dimension functions, please consult Looker Functions and Operators.
Sample Race Grouping
Strategy: Nested IF statement
The summary of the Looker syntax for achieving this is:
if(${[field name]}="Response 1", "New Response", [field name],
if(${[field name]}="Response 2", "New Response", [field name],
if(${field name]}="Response 3", "New Response", [field name],
(this strategy can continue for as many times and different responses as needed)
if(is_null(${[field name]}), "New Response", [field name]))))
- For ease, add the Race dimension to the data table, download the data as CSV
- This will be used for copying and pasting exact values
- Open the Excel file for copying and pasting the existing responses that will be changed
- Complete the formula as shown below:
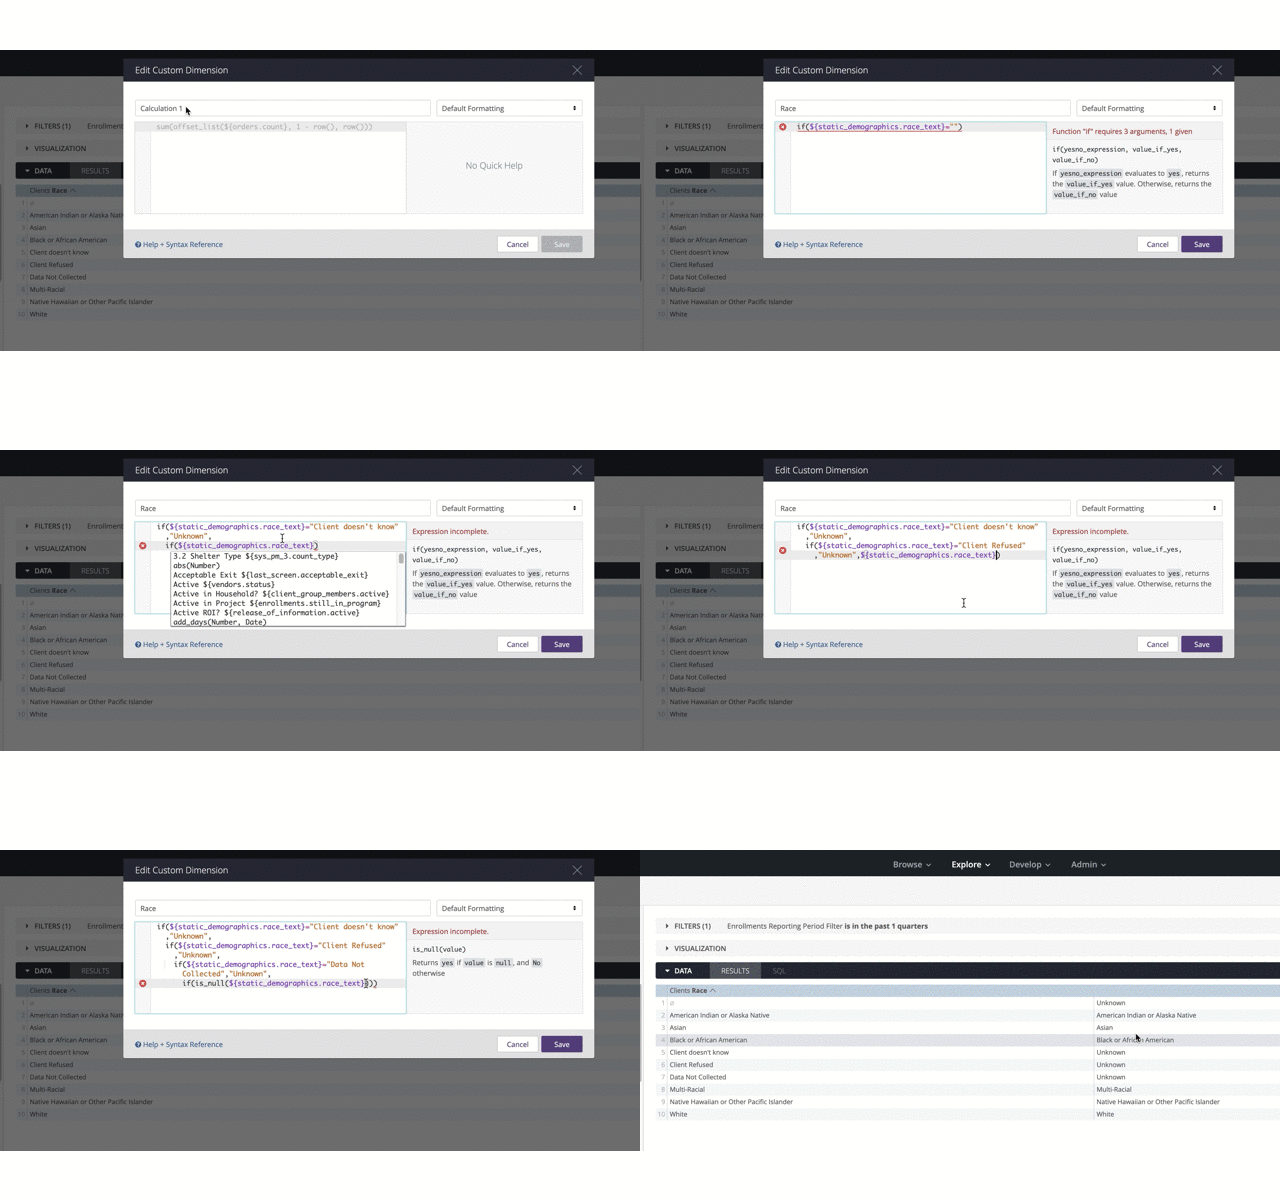
Shortcut: copy and paste the following:
if(${static_demographics.race_text}="Client doesn't know","Unknown",
if(${static_demographics.race_text}="Client prefers not to answer","Unknown",
if(${static_demographics.race_text}="Data not collected","Unknown",
if(is_null(${static_demographics.race_text}),"Unknown",${static_demographics.race_text}))))
Pro Tip
- Start each "if" statement on a new row as shown above.
- The number of closing parentheses should match the number of "if" statements in the formula.
- Picklist values are case-sensitive. Please make sure the picklist values match the picklist values in Clarity Human Services.
Custom Measures may be created two ways:
- Creating a Custom Measure from a Dimension
- Creating a Filtered Custom Measure from Another Measure
Creating a custom measure from multiple views with certain aggregations is not supported by Looker
Creating a Custom Measure from a Dimension
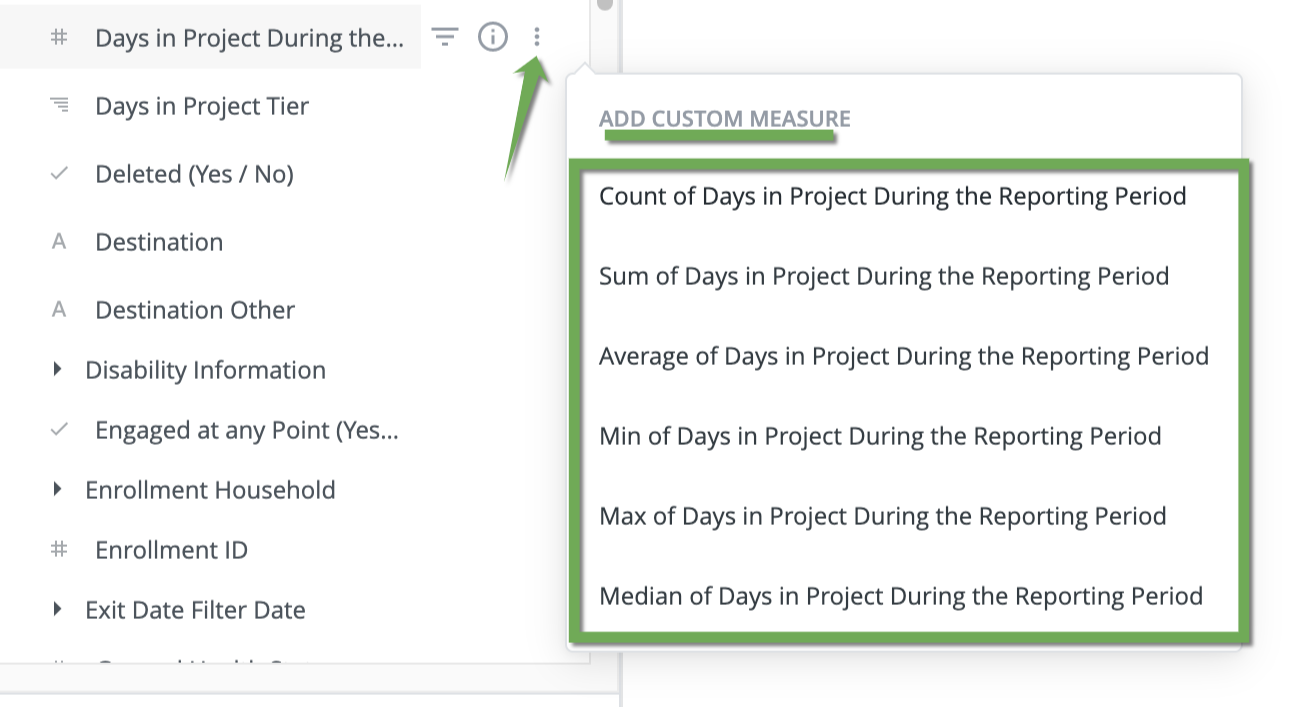
This is one of the simplest ways to create a customized field. From the dimension, click on the gear icon then choose which functions to use.
Creating a Filtered Custom Measure from Another Measure
This method allows a user to copy an existing measure and add a filter. Start with the dimension and click on the gear icon, then choose "Filter Measure"

From here, it is a matter of defining the desired filter. For example:
- Any Disability = Yes
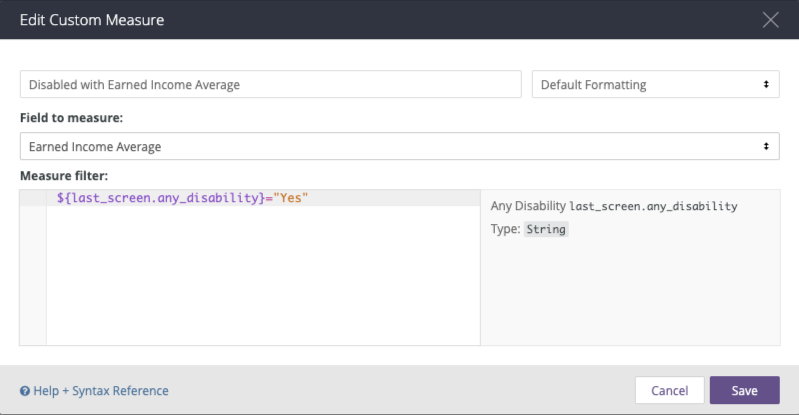
Complete the Custom Measure screen using similar methods demonstrated for Table Calculations and Custom Dimensions.
The resulting column for this custom measure will calculate the Average Earned Income for those with disabilities. It will not filter the entire Look to only those with a disability.

Updated: 12/21/2023