Purpose
The Coordinated Entry: Configuration and System Review dashboard was designed with the complexities of Coordinated Entry setup in mind. The dashboard contains Looks highlighting Programs, Community Queues, Assessments, and Non-Community Queue Referrals to pinpoint potential configuration issues and to ensure the proper entities are following Coordinated Entry workflows. Each community has a different Coordinated Entry set up and this dashboard was created with a universal review methodology in mind based on commonly utilized troubleshooting guidance.


Dashboard Details
This dashboard is accessible in Looker by utilizing the following pathway:
- “All Folders”
- “LookML Dashboards”
- “Coordinated Entry: Configuration and System Review”
- “LookML Dashboards”
Once selected, your dashboard will begin to run. This dashboard utilizes the Project Descriptor and Coordinated Entry models.
Filters

The following filters are available for this dashboard:
- CoC Code
- Select the CoC(s) to include in the dashboard.
- The Community Queue CoC Code will be null if a community uses default referral settings. To filter for a null CoC Code, use the CoC Code filter and change to “is null”
- Select the CoC(s) to include in the dashboard.
- Community Queue Status
- Select the Community Queue status for the Community Queue Information section.
- Agency Name
- Select the Agency(-ies) to include in the dashboard. This filter is linked to the Program Name filter. Once selected, this filter will also update Program Name to only include programs associated with the selected agency(-ies).
- Program Status
- Select the Program Status to include in the dashboard. Similar to the Agency Name filter, this filter is also linked to the Program Name filter and will impact which Program Names can be included in the dashboard.
- Program Name
- Select the name(s) of programs to include in the dashboard.
- Assessment Status
- Select the Assessment Status to include in the dashboard. This filter is linked to the Assessment Name filter.
- Assessment Name
- Select the name(s) of assessments to include in the dashboard.
Tile Overview
The dashboard contains 12 tiles broken down into 4 sections: Coordinated Entry Project Review, Community Queue Information, Assessment Information, and Non-Community Queue Referrals. Each Look has an information bubble containing applicable filters.
Coordinated Entry Project Review
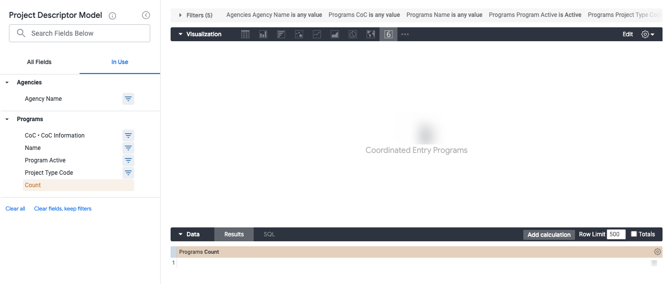
Coordinated Entry Programs Count
This Look contains a single value visualization with a count of Coordinated Entry Programs.
Applicable Filters: CoC Code, Agency Name, Program Status, and Program Name
- Filters
-
- Programs - Project Type Code: is equal to Coordinated Entry
- Measures
-
- Programs - Count
- “Explore from Here”
- There are two ways to explore this Look to obtain more information.
- Select “Explore from Here”, then click on the count in the data section for a drill down containing Program ID, Program Name, Project Type Code, Program Status, Agency Name, and Agency ID.
- This drill down Look can also be achieved by selecting the count on the dashboard tile.
- There are two ways to explore this Look to obtain more information.
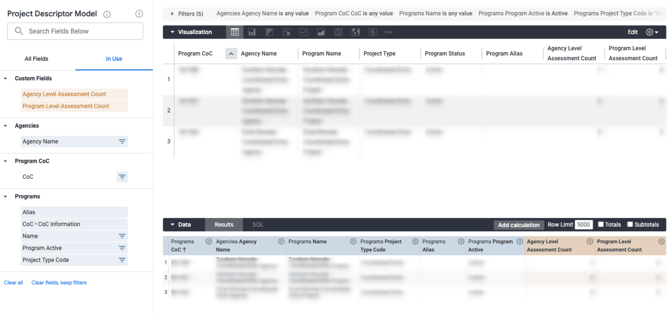
CE Program Review
This Look contains a table visualization with Coordinated Entry project information including Program CoC, Agency Name, Program Name, Project Type, Program Status, Program Alias, Agency Level Assessment Count, and Program Level Assessment Count.
Applicable Filters: CoC Code, Agency Name, Program Status, and Program Name
- Filters
-
- Programs - Project Type Code: is equal to Coordinated Entry
- Custom Measures
-
- Agency Level Assessment Count
- Field to Measure: Agency Assessments - Assessment ID
- Measure Type: Count distinct
- Filters
- Agency Assessments - Assessment Usage is Agency Only OR Agency and Programs
- Program Level Assessment Count
- Field to Measure: Agency Assessments - Assessment Name
- Measure Type: Count distinct
- Filters
- Program Assessments - Is Assessment Active in Program Settings? is Yes
- Agency Level Assessment Count
- Dimensions
-
- Agencies - Agency Name
- Programs - Alias
- Programs - CoC - CoC Information
- Programs - Name
- Programs - Program Active
- Programs - Project Type Code
- “Explore from Here”
- Drill down functionality is not available for this Look.
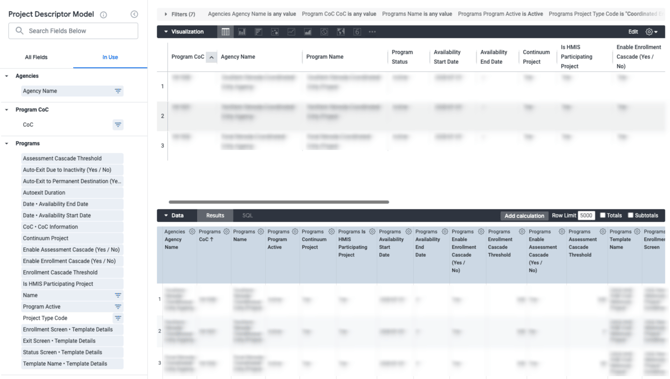
Detailed CE Program Overview
This Look contains a table visualization with a detailed overview of CE programs including Program CoC, Agency Name, Program Name, Program Status, Availability Start/End Date, Continuum Project (Yes/No), HMIS Participating Project (Yes/No), Enable Enrollment Cascade (Yes/No), Assessment Cascade Threshold, Template Name, Enrollment Screen, Status Screen, Exit Screen, Auto-Exit Due to Inactivity (Yes/No), Autoexit Duration, and Auto-Exit to Permanent Destination (Yes/No).
Applicable Filters: CoC Code, Agency Name, Program Status, and Program Name
- Filters
-
- Programs - Project Type Code: is equal to Coordinated Entry
- Dimensions
-
- Agencies - Agency Name
-
- Programs - Assessment Cascade Threshold
- Programs - Auto-Exit Due to Inactivity (Yes / No)
- Programs - Auto-Exit to Permanent Destination (Yes / No)
- Programs - Autoexit Duration
- Programs - Date • Availability End Date
- Programs - Date • Availability Start Date
- Programs - CoC • CoC Information
- Programs - Continuum Project
- Programs - Enable Assessment Cascade (Yes / No)
- Programs - Enable Enrollment Cascade (Yes / No)
- Programs - Enrollment Cascade Threshold
- Programs - Current HMIS Participation Status
- Programs - Current HMIS Participation Status Start Date
- Programs - Current HMIS Participation Status End Date
- Programs - Name
- Programs - Enrollment Screen • Template Details
- Programs - Exit Screen • Template Details
- Programs - Status Screen • Template Details
- Programs - Template Name • Template Details
- “Explore from Here”
- Drill down functionality is not available for this Look.
Programs Referring to Community Queues - Past 6 Months
This Look contains a table visualization containing the count of referrals and assessments sent to queues by assessing program in the past 6 months. This Look contains active and inactive Community Queue information for review purposes.
Applicable Filters: CoC Code, Agency Name, Program Name, and Assessment Name
Filter Notes: The 'Agency Name' filter filters on the 'Assessing Agency' for this Look. The 'Program Name' filter filters on the 'Assessing Program Name'.
- Dimensions
- Client Assessments - CoC • Assessing Agency
- Client Assessments - Assessing Program
- Referrals - CoC • Referral Community Queues
- Referrals - Name • Referral Community Queues
- Measures
-
- Client Assessments - Count
- Referrals - Count
- “Explore from Here”
-
- There are two ways to explore this Look to obtain more information.
- Select “Explore from Here”, then click on any count in the data section for a drill down.
- Client Assessments Count drill downs content Personal ID, Unique Identifier, Assessing Agency Name, Assessing Program, Assessment ID, and Assessment Score.
- Referral Count drill downs contain Personal ID, Referrals ID, and Referral Method.
- The drill down Looks can also be achieved by selecting the counts in the table on the dashboard tile.
- Select “Explore from Here”, then click on any count in the data section for a drill down.
- There are two ways to explore this Look to obtain more information.

Community Queue Information
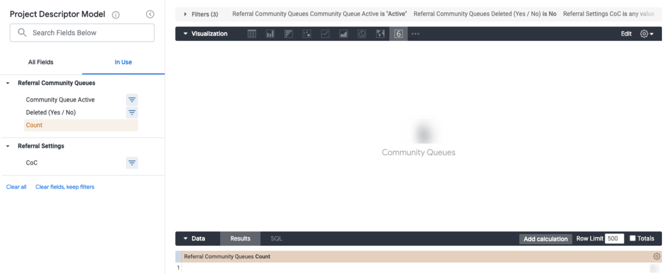
Community Queues Count
This Look contains a single value visualization with a count of Community Queues.
Applicable Filters: CoC Code, and CQ Status
- Filters
-
- Referral Community Queues - Deleted (Yes/No): is No
- Measures
-
- Referral Community Queues - Count
- “Explore from Here”
- There are two ways to explore this Look to obtain more information.
- Select “Explore from Here”, then click on the count in the data section for a drill down containing Community Queue ID, Community Queue Name, and Is this the Default Community Queue? (Yes/No).
- This drill down Look can also be achieved by selecting the count on the dashboard tile.
- There are two ways to explore this Look to obtain more information.
CE Assessing Program -> CE Assessments -> Community Queue Flow
This Look contains a Sankey diagram depicting the connection between CE Assessing Programs, CE Assessments, and Community Queue using two merged queries. The queries are merged by Assessments and built in the Project Descriptor Model.
Applicable Filters: CoC Code, CQ Status, Agency Name, Program Status, Program Name, Assessment Status, and Assessment Name
Primary Query
- Filters
-
- Program Assessment Screens • Is Assessment Active in Program Settings?: is equal to Yes
- Program Assessment Screens • Is Coordinated Entry: is equal to Yes
- Dimensions
-
- Program Assessment Screens - Assessment Name
- Programs - Name
- Measures
-
- Program Assessment Screens - Count
Secondary Query
- Dimensions
-
- Referral Community Queues - Assessment Name
- Referral Community Queues - Community Queue Name
- Referral Settings - CoC
- Screens - Assessment Name
- Screens - Status
Merged Results
- Table Calculations
-
- Hide Inactive and Assessments Not Connected to CQs
- Expression:
-
if(is_null(${referral_community_queues.name}) OR is_null(${screens.status}),no,yes)
-
- Expression:
- Hide Inactive and Assessments Not Connected to CQs
-
-
- Hide “No’s” from Visualization
- CQ
- Expression:
-
concat(${referral_settings.ref_coc},": ",${referral_community_queues.name})
-
- Expression:
-
- “Explore from Here”
- Select “Explore from Here”, then click on the Program Assessment Screens count in the data section for a drill down containing Assessment ID, Assessment Name, and Type.

Community Queue Detail
This Look contains a table visualization with detailed Community Queue configuration options including Community Queue Name, Referral Settings CoC, Community Queue Status, Use Most Recent Assessment, Matching Process, Prioritization, Community Referral Threshold, Automated Removal from Queue, List of Assessment Name, List of Tracked Characteristic, Last Updated Date, Program Availability Management, Inactive Referral Expiration Threshold, Allow Moving to Queue, and Display Option to “Send to Queue” at Denial. If using default filters, this Look only includes active, non-deleted Community Queues.
Applicable Filters: CoC Code, CQ Status, and Assessment Name
- Filters
-
- Referral Community Queues - Deleted (Yes/No): is No
- Custom Fields
-
- Custom Measures
- List of Assessment Name
- Field to Measure: Referral Community Queues - Assessment Name
- Measure Type: List of unique values
- List of Tracked Characteristics
- Field to Measure: Referral Community Queues - Tracked Characteristic
- Measure Type: List of unique values
- List of Assessment Name
- Custom Measures
- Dimensions
-
- Referral Community Queues - Allow Moving to Queue
- Referral Community Queues - Automated removal from the Community Queue (Yes / No)
- Referral Community Queues - Community Queue Active
- Referral Community Queues - Community Queue Name
- Referral Community Queues - Community Referral Threshold (Days)
- Referral Community Queues - Display Option to "Send to Queue" at Denial
- Referral Community Queues - Inactive Referral Expiration Threshold (Days)
- Referral Community Queues - Is this the Default Community Queue? (Yes / No)
- Referral Community Queues - Date • Last Updated Date
- Referral Community Queues - Matching Process
- Referral Community Queues - Prioritization
- Referral Community Queues - Program Availability Management
- Referral Community Queues - Use Most Recent Assessment?
- Referral Settings - CoC
- “Explore from Here”
- Drill down functionality is not available for this Look.

Assessment Information
CE Assessments Connected to CQs Count
This Look contains a single value visualization with a count of Coordinated Entry Assessments connected to Community Queues compared to a total count of Coordinated Entry Assessments.
Applicable Filters: Community Queue Status, Assessment Status, and Assessment Name
- Custom Fields
-
- Custom Measures
-
- CE Assessments
- Field to Measure: Screens - Count
- Filters:
- Screens - Is Coordinated Entry: is Yes
- Count of Assessment Name
- Field to Measure: Referral Community Queues - Assessment Name
- Measure Type: Count Distinct
- Filters:
- Referral Community Queues - Deleted (Yes/No): is No
- Custom filter:
- Expression:
-
${screens.name}=${community_queue_assessments.name}
-
- Expression:
- Field to Measure: Referral Community Queues - Assessment Name
- CE Assessments
-
- Custom Measures
-
- Table Calculations
- CE Assessments Connected to CQs
- Expression:
-
${count_of_assessment_name:total}
-
- Expression:
- CE Assessments Connected to CQs
- Table Calculations
-
-
- Total CE Assessments
- Expression:
-
${ce_assessments:total}
-
- Expression:
- Total CE Assessments
-
- Dimensions
-
- Screens - Assessment Name
- “Explore from Here”
- Select “Explore from Here”, then click on the CE Assessments count in the data section for a drill down containing Assessment ID, Assessment Name, and Type.

CE Assessment Details
This Look contains a table visualization with Coordinated Entry Assessment details including Assessment Name, Assessment Status, Coordinated Entry Assessment (Yes/No), Eligibility Engine (Yes/No), Screen Last Updated Date, Count of Agencies with Assessment Cascade Enabled, Count of Agencies with Assessment Toggled On, Count of Programs that can Administer the Assessment, Count of Agencies with Assessment Usage = Programs Only, Count of Agencies with Assessment Usage = Agency Only, Count of Agencies with Assessment Usage = Agency and Programs, and Programs Count. The three queries that make up this table are built with the Project Descriptor Model and merged on Assessments.
Applicable Filters: CoC Code, Program Status, Assessment Status, and Assessment Name
Primary Query (Screens)
- Filters
-
- Screens - Is Coordinated Entry: is Yes
- Dimensions
-
- Screens - Assessment Name
- Screens - Is Coordinated Entry
- Screens - Eligibility Engine (Yes/No)
- Screens - Date - Last Updated Date
- Screens - Status
Secondary Query (Agency Assessment Settings)
- Filters
-
- Agency Screens - Is Coordinated Entry: is Yes
- Custom Fields
-
- Custom Measures
- Count Agencies with Assessment Cascade Enabled
- Field to Measure: Agencies - Count
- Filters: Agency Assessments - Enable Assessment Cascade (Yes/No): is Yes
- Count of Agencies with Assessment Usage= 'Agency and Programs'
- Field to Measure: Agencies - Count
- Filters: Agency Assessments - Assessment Usage: is Agency and Programs
- Count of Agencies with Assessment Usage= 'Agency Only'
- Field to Measure: Agencies - Count
- Filters: Agency Assessments - Assessment Usage: is Programs
- Count of Agencies with Assessment Usage= 'Programs Only'
- Field to Measure: Agencies - Count
- Filters: Agency Assessments - Assessment Usage: is Agency
- Count Agencies with Assessment Cascade Enabled
- Custom Measures
- Dimensions
-
- Agency Screens - Assessment Name
- Measures
-
- Agencies - Count
Tertiary Query (Program Assessments)
- Filters
-
- Program Assessment Screens - Is Coordinated Entry: is Yes
- Dimensions
-
- Program Assessment Screens - Assessment Name
- Measures
-
- Programs - Count
Merged Results Table
- “Explore from Here”
- There are two ways to explore this Look to obtain more information.
- Select “Explore from Here”, then click on the count in the data section for a drill down. Agency Counts contain Agency ID, Agency Name, CoC Code, and Agency Status and Program Counts contain Program ID, Name, Project Type, Status, Agency Name, and Agency ID.
- This drill down Look can also be achieved by selecting any count on the dashboard tile.
- There are two ways to explore this Look to obtain more information.

Non-Community Queue Referrals
Non-Community Queue Referral Counts - Past 6 Months
The Look contains a multiple value visualization with Non-Community Queue Referral Counts (Direct to Program Referrals and Eligibility Determination Referrals) within the past 6 months.
Applicable Filters: CoC Code, Agency Name, and Assessment Name
Filter Notes: The 'CoC Code' filter filters on 'Referred-to Agency CoC'. The 'Agency Name' filter filters on 'Referring Agency' for this Look. Direct to Program Referrals will update to 0 if an Assessment Name filter is applied to this Look.
- Filters
-
- Referrals Date: is in the past 6 months
- Clients - Deleted (Yes/No): is No
- Referrals - Deleted (Yes/No): is No
- Custom Fields
-
- Custom Measures
- Direct to Program Referrals
- Field to Measure: Referrals - Count
- Filters: Referrals - Referral Method: is Direct to Program
- Eligibility Determination Referrals
- Field to Measure: Referrals - Count
- Filters: Referrals - Referral Method: is Eligibility Determination
- Direct to Program Referrals
- Custom Measures
- “Explore from Here”
- There are two ways to explore this Look to obtain more information.
- Select “Explore from Here”, then click on either count for a drill down containing Personal ID, Referral ID, and Referral Method.
- This drill down Look can also be achieved by selecting any count on the dashboard tile.
- There are two ways to explore this Look to obtain more information.

Direct to Program Referrals - Past 6 Months
This Look contains a table visualization with direct to program referral counts by referring agency.
Applicable Filters: CoC Code and Agency Name.
Filter Notes: The 'Agency Name' filter filters on 'Referring Agency' for this Look. The 'CoC Code' filter filters on 'Referred-to Agency CoC'.
- Filters
-
- Clients - Deleted (Yes/No): is No
- Referrals Date: is in the past 6 months
- Referrals - Deleted (Yes/No): is No
- Referrals - Referral Method: is equal to Direct to Program
- Dimensions
-
- Referrals - Referring Agency
- Measures
-
- Referrals - Count
- “Explore from Here”
- There are two ways to explore this Look to obtain more information.
- Select “Explore from Here”, then click on a referral count for a drill down containing Personal ID, Referral ID, and Referral Method.
- This drill down Look can also be achieved by selecting a count on the dashboard tile.
- There are two ways to explore this Look to obtain more information.

Eligibility Determination Screen Referrals - Past 6 Months
This Look contains a table visualization with eligibility determination referral counts by referring agency and referred assessment.
Applicable Filters: CoC Code, Agency Name, and Assessment Name.
Filter Notes: The 'Agency Name' filter filters on 'Referring Agency' for this Look. The 'CoC Code' filter filters on 'Referred-to Agency CoC'.
- Filters
-
- Client Assessments - Deleted (Yes/No): is No
- Clients - Deleted (Yes/No): is No
- Referrals Date: is in the past 6 months
- Referrals - Deleted (Yes/No): is No
- Referrals - Referral Method: is equal to Referral from Eligibility Determination
- Dimensions
-
- Client Assessments - Assessment Name
- Referrals - Referring Agency (pivot)
- Measures
-
- Referrals - Count
- “Explore from Here”
- There are two ways to explore this Look to obtain more information.
- Select “Explore from Here”, then click on the referral count for a drill down containing Personal ID, Referral ID, and Referral Method.
- This drill down Look can also be achieved by selecting the count on the dashboard tile.
- There are two ways to explore this Look to obtain more information.

Updated: 10/01/2023