APR Submittal Preparation
This built-in LookML Dashboard is designed with program managers in mind. The included tiles provide insight into enrollments that may cause problems with submitting APRs.
The dashboard is meant to supplement, not replace, the [HUDX-225] HMIS Data Quality Report available in the Clarity Human Services Report Library. Run [HUDX-225] for insight into field specific data quality problems.

Each of the tiles drill down to a list of enrollments with the described problem.
Included Tiles
The tiles were created using either the HMIS Performance or the Data Quality Model.
Project Start After Project Exit
This tile returns a count of the number of enrollments that have a Project Start Date greater than the Project Exit date. This problem can occur if a user incorrectly updates the Start Date after the Project Exit has been created. It can also occur during a Data Integration.
Model: HMIS Performance
Fields
- Custom Measure
- Project Start AFTER Project Exit

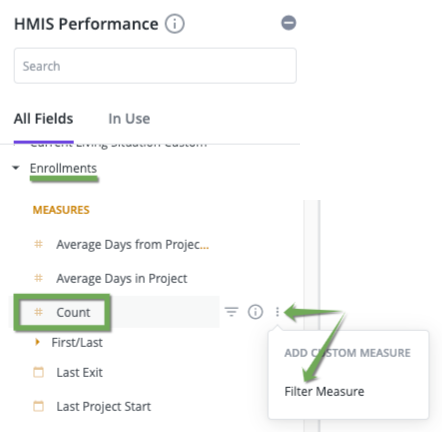
- Under the Enrollments view, Count, click on the

- Click on Filter Measure
- Change the name to "Project Start > Project Exit"
- Paste the following into the formula area:
- Under the Enrollments view, Count, click on the
- Project Start AFTER Project Exit
-
-
-
- ${enrollments.start_date}>${enrollments.end_date}
-
-
-
-
- Save the measure
-
Filters
- Enrollments, Is Last Enrollment per Program (Yes / No) is Yes
Visualization
Single Value, likely the default visualization.
DoB AFTER Project Start
This problem usually occurs when there is a birth in the family or when the wrong year is used for the client's date of birth. (for example, the current year)
Model: HMIS Performance
Fields
- Custom Measure
- Date of Birth After Project Start
- Under the Enrollments view, Count, create a custom Filter Measure (see above image)
- Paste the following into the formula area
-
-
- ${clients.birth_date}>${enrollments.start_date}
-
-
- Save the measure
Filters
- Enrollments, Is Last Enrollment per Program (Yes / No) is Yes
Visualization
Single Value, likely the default visualization.
Move-in Date AFTER Project Exit
Model: HMIS Performance
Fields
- Custom Measure
- Move-in Date After Project Start
- Under the Enrollments view, Count, create a custom Filter Measure (see above image)
- Paste the following into the formula area
-
-
- ${entry_screen.move_in_date}>${enrollments.end_date}
-
-
- Save the measure
Filters
- Enrollments, Is Last Enrollment per Program (Yes / No) is Yes
- Entry Screen, Head of Household (Yes / No) is Yes
Visualization
Single Value, likely the default visualization.
Move-in Date Before Project Exit
Model: HMIS Performance
Fields
- Custom Measure
- Move-in Date Before Project Start
- Under the Enrollments view, Count, create a custom Filter Measure (see above image)
- Paste the following into the formula area
-
-
- ${entry_screen.move_in_date}<${enrollments.start_date}
-
-
- Save the measure
Filters
- Enrollments, Is Last Enrollment per Program (Yes / No) is Yes
- Entry Screen, Head of Household (Yes / No) is Yes
Visualization
Single Value, likely the default visualization.
Households with More than One HoH
Starting in October of 2021, all HMIS and Federal Partner reporting will require household enrollments have the same Head of Household from Project Start to Project Exit. This tile is designed to return those households where at any time during the enrollment, there have been two or more different heads of household.
Model: Data Quality
Fields
- Custom Measure
- Households with More than One HoH
- Under the Enrollments view, Count, create a custom Filter Measure (see above image)
- Paste the following into the formula area
-
-
- ${dq_client_program_demographics.relationship_to_hoh_error}="In household with more than one Head of Household"
-
-
- Save the measure
Filters
- Enrollments, Is Last Enrollment per Program (Yes / No) is Yes
- Entry Screen, Head of Household (Yes / No) is Yes
Visualization
Single Value, likely the default visualization.
Annual Assessment Status
Model: Data Quality
Fields
- DQ Annual Assessments, Annual Assessment Status
- Enrollments, Count
Filters
- DQ Annual Assessments, Annual Assessment Status matches (advanced) Completed, Completed out of range, Due in 30-60 days, Past Due, Due
Visualization
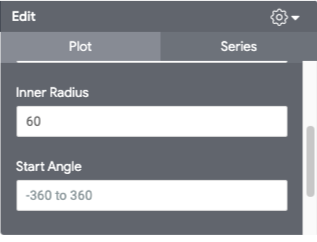
This visualization is a Pie Chart with an Inner Radius of 60.

Dashboard Filters
The following filters have been added to the dashboard:
- Reporting Period Filter - Default is in the last 12 complete months
- Programs Full Name - optional filter
- Project Type Code - optional filter
The filters affect all of the dashboard tiles.