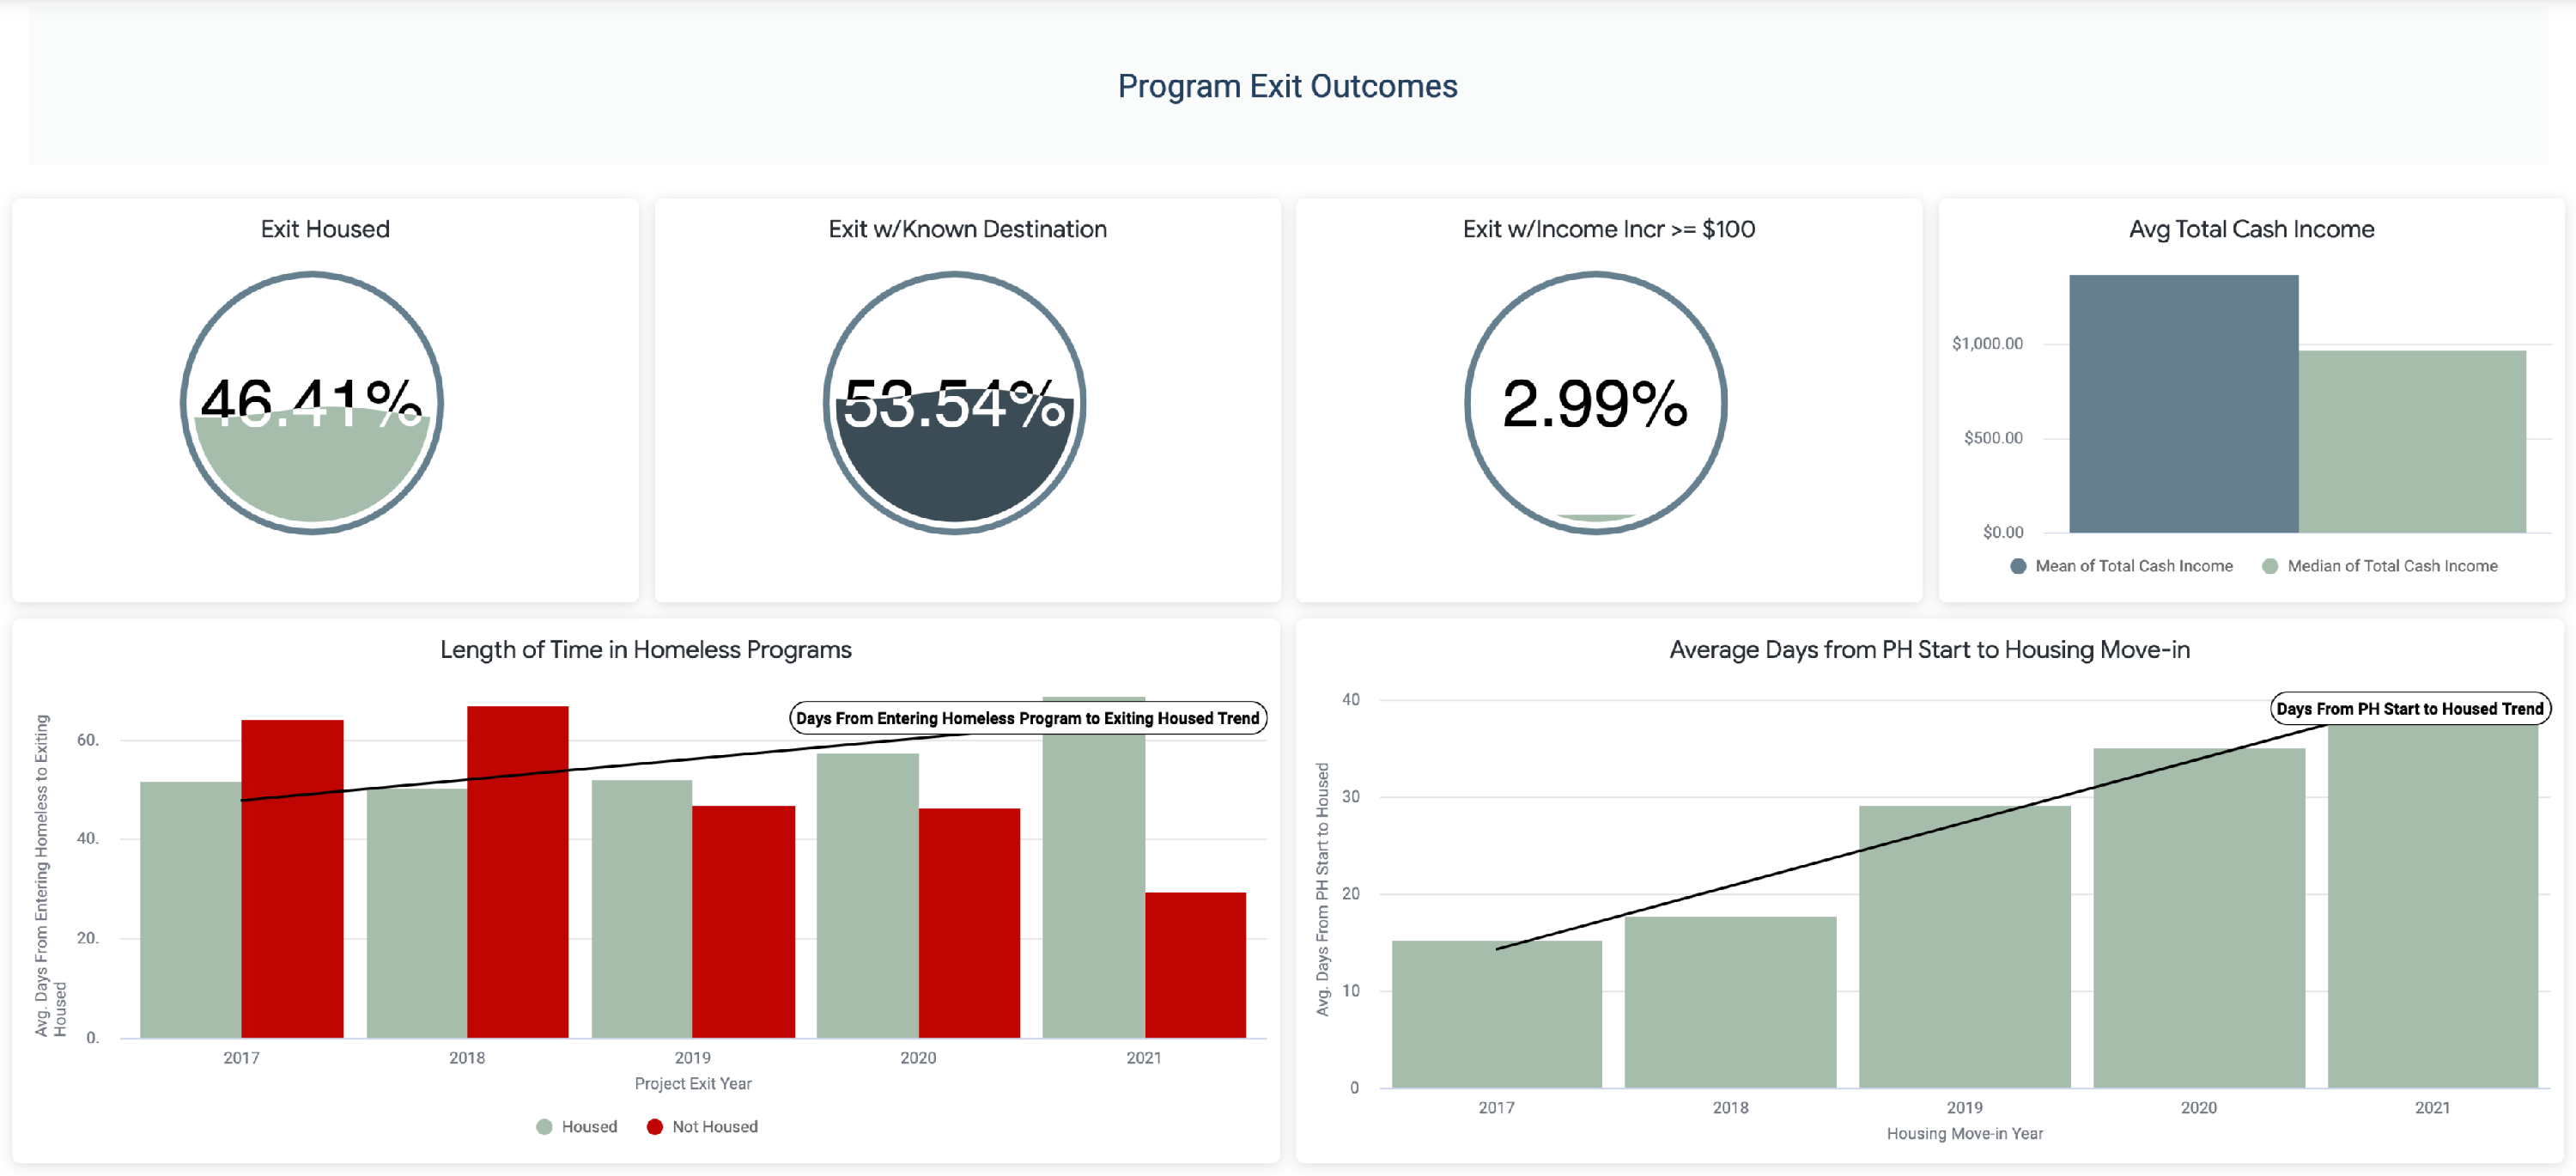
This dashboard was designed to give managers and stakeholders insight into exit outcomes of program participation as well as the populations served by the program.
The Program Management dashboard will be available in the LookML dashboards mid-June, 2021.

Included Tiles
Unless otherwise noted, all tiles are from the HMIS Performance model.
Exit Housed
This tile displays the percentage of exits where the client exited to a permanent housing destination. Refer to HMIS Data Dictionary, Appendix A for a list of destinations.
Fields
- Custom Measures
- Exited Clients
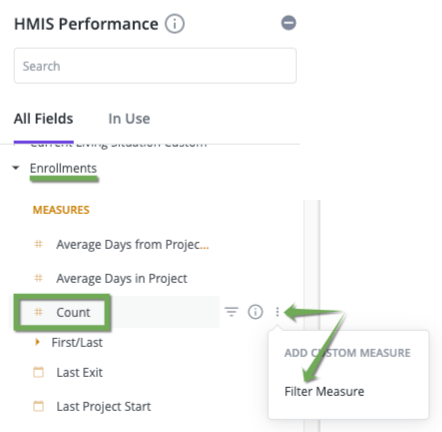 Under the Enrollments view, Count, click on the
- Click on Filter Measure
- Change the name to "Exited Clients"
- Paste the following into the formula area:
- Exited Clients
is_null(${enrollments.end_date})=no
-
-
-
- Save the measure
- Hide from the visualization
-
-
- Housed on Exit Count
- Repeat the above but name the field "Housed on Exit Count"
- Formula:
- ${last_screen.housed_on_exit}="Housed"
-
-
- Hide from the visualization
-
- Table Calculation
- Create a Table Calculation:
- "Percent Housed on Exit":
- Create a Table Calculation:
-
-
-
- (${housed_on_exit_count}/${exited_clients})*100
-
-
Filters
- Enrollments, Reporting Period Filter: is in the past 12 complete months
Visualization
This tile uses a Liquid Fuel Gauge visualization.
Exit w/Known Destination
This tile shows the percent of exits with a known destination.
Fields
- DQ Client UDE, Destination Error Count - Hide from the visualization
- Custom Measure
- Using the method described in Exit Housed to create a measure for "Exited Clients"
-
-
- is_null(${dq_client_programs.end_date})=no
-
-
-
-
- Hide from the Visualization
-
-
- Table Calculations
- Exited with Known Destination
- ${exited_clients}-${dq_client_program_demographics.exit_destination_error_count}
-
- Hide from the visualization
- Percent Exited with Known Destination
- ${exited_with_known_destination}/${exited_clients})*100
Filters
- Enrollments, Reporting Period Filter: is in the past 12 complete months
Visualization
This tile uses a Liquid Fuel Gauge visualization.
Exit w/Income Increase >= $100
This tile shows the percent of exits with a known destination.
- Fields
- Custom Measure
Using the method described in Exit Housed to create a measure for "Exited Clients"
- Custom Measure
-
-
- is_null(${dq_client_programs.end_date})=no
-
-
-
-
- Hide from the visualization
-
-
- Table Calculations
- Increase Income by >=$100
-
-
- ${last_screen.income_change}>=100
-
-
-
-
- Hide from the visualization
-
-
- Percent Increased Income by >=$100
(${increase_income_by_100}/${exited_clients})*100
Filters
- Enrollments, Reporting Period Filter: is in the past 12 complete months
- Programs, Tracking Method: is not equal to Night-by-Night
- Custom Filter:
- ${entry_screen.head_of_household}=yes OR ${clients.age}>=18
Visualization
This tile uses a Liquid Fuel Gauge visualization.
Filters
- Enrollments, Reporting Period Filter: is in the past 12 complete months
- Programs, Tracking Method: is not equal to Night-by-Night
- Custom Filter:
-
- ${entry_screen.head_of_household}=yes OR ${clients.age}>=18
Visualization
This tile uses a Liquid Fuel Gauge visualization.
Average Total Cash Income
This tile returns the mean and median income amounts for those that have exited the program.
Fields
- Update/Exit Screen, Average Cash Income (mean)
- Custom Measure:
- Median of Total Cash Income
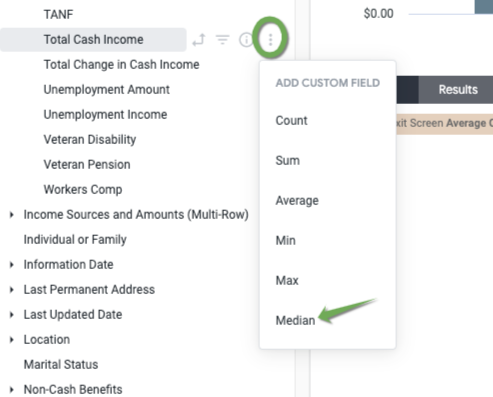
- From the Dimension for Update/Exit Screen, Total Cash Income, click on

- Choose Median
- From the Dimension for Update/Exit Screen, Total Cash Income, click on
- Median of Total Cash Income
Filters
- Enrollments, Reporting Period Filter: is in the past 12 complete months
- Programs, Tracking Method: is not equal to Night-by-Night
- Custom Filter:
-
- ${entry_screen.head_of_household}=yes OR ${clients.age}>=18
Visualization
This tile uses a simple Column chart to display the results.
Harder to Serve Target Populations
This tile identifies the percentage of clients from collection of target populations which may be considered more difficult to serve.
Fields
Most of the fields start with a standard HMIS Data element and then calculate the percentage of households in that target population.- Entry Screen, Count Households - hide the measure from the visualization
- Custom Measures
- Using a method similar to Exited Housed, create Count Mental Illness
- Under the Entry Screen view, Count Households, click on the gear
- Click on Filter Measure
- Change the name to "Count Mental Illness"
- Paste the following into the formula area:
- Under the Entry Screen view, Count Households, click on the gear
- Using a method similar to Exited Housed, create Count Mental Illness
-
-
-
- ${last_screen.health_mental}="Yes"
-
-
-
-
-
- Save the measure
- Hide from the visualization
-
- Repeat for Count Alcohol Abuse
-
-
-
- ${last_screen.health_substance_abuse}="Alcohol Abuse"
-
-
-
-
- Hide from the visualization
-
- Count Drug Abuse
-
-
-
- ${last_screen.health_substance_abuse}="Drug Abuse"
-
-
-
-
- Hide measure
-
- Count Both Alcohol and Drug Abuse
-
-
-
- ${last_screen.health_substance_abuse}="Both Alcohol and Drug Abuse"
-
-
-
-
- Hide measure
-
- Count Chronic Health Condition
-
-
-
- ${last_screen.health_chronic}="yes"
-
-
-
-
- Hide measure
-
- Count HIV
-
-
-
- ${last_screen.health_hiv}="yes"
-
-
-
-
- Hide measure
-
- Count Developmental Disabilities
-
-
-
- ${last_screen.health_dev_disability}="yes"
-
-
-
-
- Hide measure
-
- Count Physical Disabilities
-
-
-
- ${last_screen.health_phys_disability}="yes"
-
-
-
-
- Hide measure
-
- Count Domestic Violence
-
-
-
- ${entry_screen.health_dv}="yes"
-
-
-
-
- Hide measure
-
- Count Unaccompanied under age 18
-
-
-
- ${household_makeup.household_type}="households with only children" OR ${household_makeup.household_type}= "single child"
-
-
-
-
- Hide measure
-
-
-
-
- Count Unaccompanied TAY age 18-24 year
-
-
-
-
- ${household_makeup.oldest}<25 AND ${household_makeup.oldest} >=18
-
-
-
-
-
-
- Hide measure
-
-
-
- Table Calculations
- Create percent calculations for each of the target populations
- Mental Illness
-
-
- ${count_mental_illness}/${entry_screen.count_households}
-
-
- Alcohol Abuse
-
-
- ${count_alcohol_abuse}/${entry_screen.count_households}
-
-
- Drug Abuse
-
-
- ${count_alcohol_abuse}/${entry_screen.count_households}
-
-
- Both Alcohol and Drug Abuse
-
-
- ${count_both_alcohol_and_drug_abuse}/${entry_screen.count_households}
-
-
- Chronic Health Condition
-
-
- ${count_chronic_health_condition}/${entry_screen.count_households}
-
-
- HIV
-
-
- ${count_hiv}/${entry_screen.count_households}
-
-
- Developmental Disabilities
-
-
- ${count_developmental_disabilities}/${entry_screen.count_households}
-
-
- Physical Disabilities
-
-
- ${count_physical_disabilities}/${entry_screen.count_households}
-
-
- Domestic Violence
-
-
- ${count_domestic_violence}/${entry_screen.count_households}
-
-
- Unaccompanied Youth under age 18
-
-
- ${count_unaccompanied_under_age_18}/${entry_screen.count_households}
-
-
- Unaccompanied TAY age 18-24
-
-
- ${count_unaccompanied_tay_age_18_24_year}/${entry_screen.count_households}
-
Filters
- Enrollments, Reporting Period Filter: is in the past 12 complete months
Visualization
This tile is a simple horizontal bar chart.
Household Challenges
This tile goes hand-in-hand with Harder to Serve Target Populations. It looks at the percent of households belonging to 1 or more of the Target Populations. It also provides the percent of Households with Challenges.
Fields
- Entry Screen, Count Households - Hide from visualization
- Custom Measures
- Under the Entry Screen view, Count Households, click on the gear
- Click on Filter Measure
- Change the name to "Count of 1 Target Population"
- Paste the following into the formula area:
- Under the Entry Screen view, Count Households, click on the gear
-
-
-
- (if(${entry_screen.health_mental}="Yes",1,0) +
if((${entry_screen.health_substance_abuse}="Drug Abuse" OR ${entry_screen.health_substance_abuse}="Both Alcohol and Drug Abuse" OR ${entry_screen.health_substance_abuse}="Alcohol Abuse"),1,0) +
if(${entry_screen.health_chronic}="Yes",1,0) +
if(${entry_screen.health_hiv}="Yes",1,0) +
if(${entry_screen.health_dev_disability}="Yes",1,0) +
if(${entry_screen.health_phys_disability}="Yes",1,0) +
if(${entry_screen.health_dv}="Yes",1,0) +
if((${household_makeup.household_type}="Single Child" OR ${household_makeup.household_type}="Households with only Children"), 1,0) +
if((${household_makeup.oldest}<25 AND ${household_makeup.oldest}>=18),1,0))=1
- (if(${entry_screen.health_mental}="Yes",1,0) +
-
-
-
-
- Save the measure
- Hide from the visualization
- Repeat for Count of 2 Target Populations
-
-
-
- (if(${entry_screen.health_mental}="Yes",1,0) +
if((${entry_screen.health_substance_abuse}="Drug Abuse" OR ${entry_screen.health_substance_abuse}="Both Alcohol and Drug Abuse" OR ${entry_screen.health_substance_abuse}="Alcohol Abuse"),1,0) +
if(${entry_screen.health_chronic}="Yes",1,0) +
if(${entry_screen.health_hiv}="Yes",1,0) +
if(${entry_screen.health_dev_disability}="Yes",1,0) +
if(${entry_screen.health_phys_disability}="Yes",1,0) +
if(${entry_screen.health_dv}="Yes",1,0) +
if((${household_makeup.household_type}="Single Child" OR ${household_makeup.household_type}="Households with only Children"), 1,0) +
if((${household_makeup.oldest}<25 AND ${household_makeup.oldest}>=18),1,0))=2
- (if(${entry_screen.health_mental}="Yes",1,0) +
-
-
-
- Hide the measure
- Repeat for Count of 3 or More Target Populations
-
-
-
- (if(${entry_screen.health_mental}="Yes",1,0) +
if((${entry_screen.health_substance_abuse}="Drug Abuse" OR ${entry_screen.health_substance_abuse}="Both Alcohol and Drug Abuse" OR ${entry_screen.health_substance_abuse}="Alcohol Abuse"),1,0) +
if(${entry_screen.health_chronic}="Yes",1,0) +
if(${entry_screen.health_hiv}="Yes",1,0) +
if(${entry_screen.health_dev_disability}="Yes",1,0) +
if(${entry_screen.health_phys_disability}="Yes",1,0) +
if(${entry_screen.health_dv}="Yes",1,0) +
if((${household_makeup.household_type}="Single Child" OR ${household_makeup.household_type}="Households with only Children"), 1,0) +
if((${household_makeup.oldest}<25 AND ${household_makeup.oldest}>=18),1,0))>=3
- (if(${entry_screen.health_mental}="Yes",1,0) +
-
-
-
- Hide the measure
-
- Table Calculations
- % of Households meeting any THREE or More Target Populations
-
-
- ${count_of_3_or_more_target_populations}/${entry_screen.count_households}
-
-
- % of Households meeting any TWO Target Populations
-
-
- ${count_of_2_target_populations}/${entry_screen.count_households}
-
-
- % of Households meeting any ONE Target Populations
-
-
- ${count_of_1_target_population}/${entry_screen.count_households}
-
-
- Total % of Households w/Challenges
-
-
- ${of_households_meeting_any_one_target_populations}+${of_households_meeting_any_two_target_populations}+${of_households_meeting_any_three_or_more_target_populations}
-
Filters
- Enrollments, Reporting Period Filter: is in the past 12 complete months
Visualization
This tile is a horizontal bar chart.
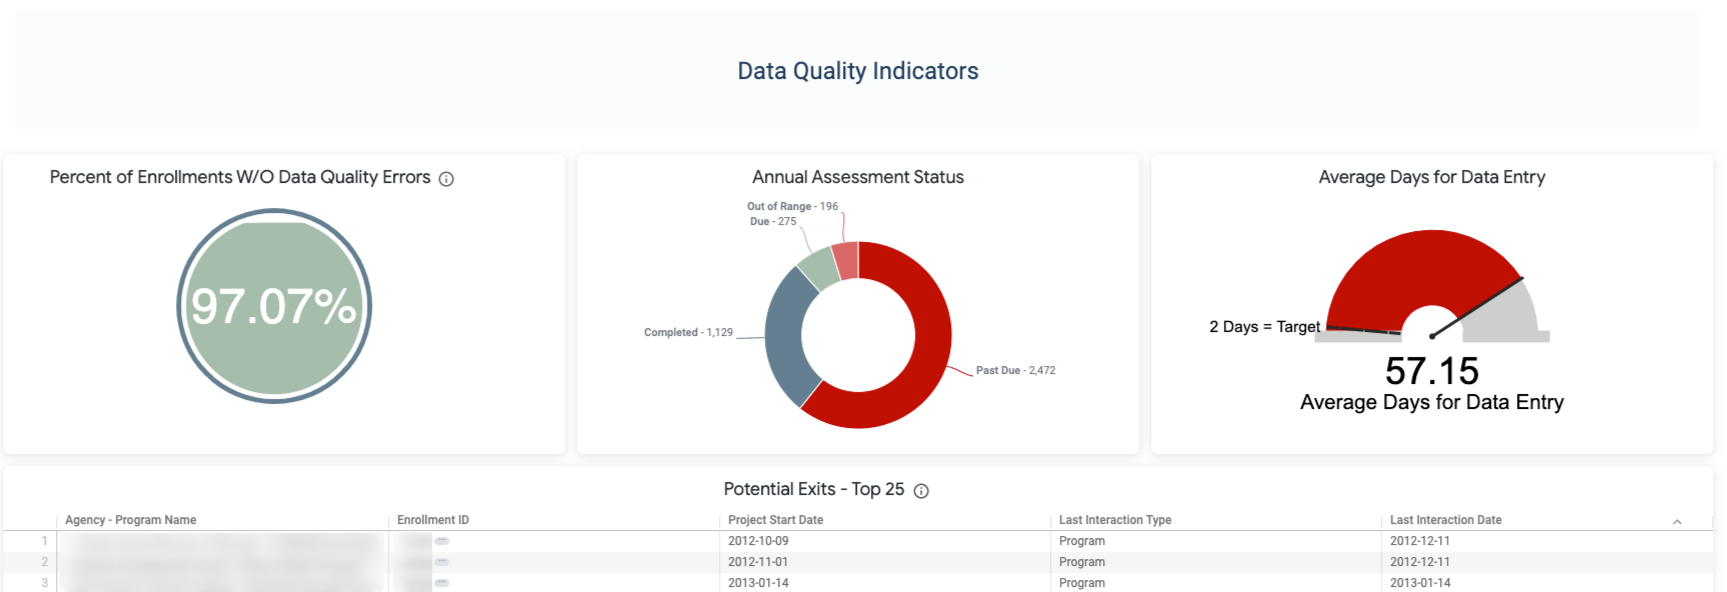
Percent of Enrollments W/O Data Quality Errors
Model: Data Quality
Fields
- Enrollments, Count - Hide from visualization
- Enrollments, Count of Enrollments with Error - Hide from visualization
- Table Calculations:
- Count of Enrollments w/o Errors:
-
-
- ${dq_client_programs.count}-${dq_client_program_demographics.enrollments_with_error}
-
-
- Percent of Enrollments W/O Errors
-
-
- (${count_of_enrollments_wo_errors}/${dq_client_programs.count})*100
-
Filters
- Enrollments, Reporting Period Filter: is in the past 12 complete months
Visualization
This visualization uses Liquid Fuel Gauge.
Annual Assessment Status
Model: Data Quality
Fields
- DQ Annual Assessments, Annual Assessment Status dimension
- Enrollments, Count
Filtering
- DQ Annual Assessments, Annual Assessment Status: matches (advanced): Completed, Completed out of range, Due in 30-60 days, Past Due, Due
- Program Funding Sources, Funding Source: matched (advanced):
- HUD: CoC - Joint Component TH/RRH,
- HUD:CoC – Homelessness Prevention (High Performing Comm. Only),
- HUD:CoC – Permanent Supportive Housing,
- HUD:CoC – Rapid Re-Housing,
- HUD:CoC – Transitional Housing,
- HUD: ESG - CV,HUD:ESG – Emergency Shelter (operating and/or essential services),
- HUD:ESG – Homelessness Prevention,
- HUD:ESG – Rapid Rehousing,
- HUD:ESG – Street Outreach,
- HUD:HOPWA – Permanent Housing (facility based or TBRA),
- HUD:HOPWA – Short-Term Rent, Mortgage, Utility assistance,
- HUD:HOPWA – Permanent Housing Placement,
- HUD:HUD/VASH,
- HHS:PATH – Street Outreach & Supportive Services Only,
- HHS:RHY – Maternity Group Home for Pregnant and Parenting Youth,
- HHS:RHY – Transitional Living Program,
- VA:Supportive Services for Veteran Families,
- VA:Grant Per Diem - Case Management/Housing Retention,
- VA:Grant Per Diem – Service Intensive Transitional Housing,
- VA:Grant Per Diem – Transition in Place,
- VA: CRS Contract Residential Services,
- VA: Community Contract Safe Haven,
- HUD: Pay for Success,
- HUD: Rural Housing Stability Assistance Program,
- HHS: RHY – Demonstration Project
- Programs, Tracking Method: is not equal to: Night-by-Night
Visualization
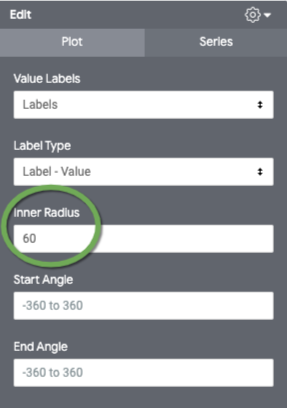
The visualization for this tile is a Pie Chart, with a donut hole. To create the hole, add an Inner Radius of 60 (or another preferred radius).
Average Days for Data Entry
This tile shows the average number of days between project start and the date the enrollment is created in HMIS.
Model: Data Quality
Fields
- Enrollments, Average Timeliness of Data Entry
Filters
- Enrollments, Reporting Period Filter: is in the past 12 complete months
Visualization
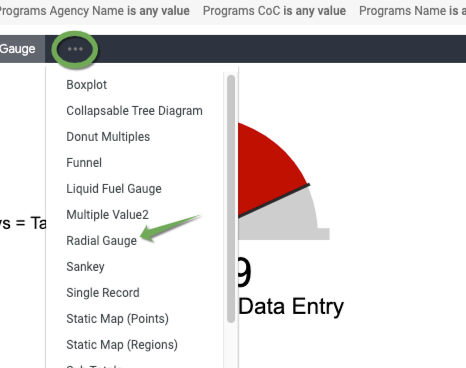
This is a new type of visualization called Radial Gauge. To Access the Radial Gauge:
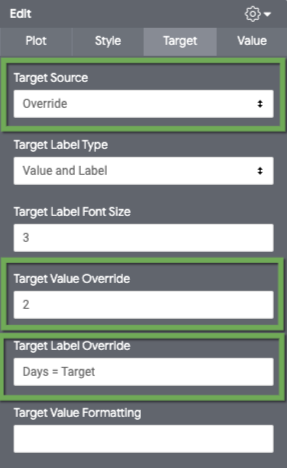
To set a target for Data Entry:
Potential Exits - Top 25
This tile displays the top 25 enrollments that have been inactive for more than 6 months.
Model: Client
Fields
- Programs, Full Name
- Enrollments, Enrollment ID
- Enrollments, Project Start Date
- Client Interactions, Last Interaction Type
- Client Interactions, Last Interaction Date
Filters
- Enrollments, Reporting Period Filter: is in the past 1 quarter
- Client Interactions, Last Interaction Date: is before 180 days ago
- Clients Deleted (Yes/No): is No
- Enrollments, Active: is equal to Yes
- Enrollments, Deleted (Yes/No): is No
- Enrollments, ID: is not null
- Enrollments, Project Start Date: is on or after 2012-10-01 (this to eliminate old enrollments, pre- HUD System Performance Measures Loopback Cutoff date)
- Custom Filter
-
- ${client_last_interaction.ref_agency}=${programs.agency_id}
Visualization
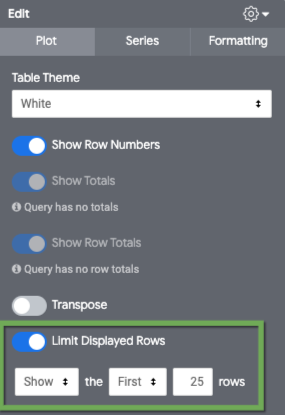
This visualization uses a standard table but is limited to the top 25 enrollments with the longest number of days inactive.
Dashboard Filters
- Program CoC
- Reporting Period Filter
- Default: is in the last 12 complete months
- Agency Name
- Program Name
- Potential Exits Cutoff Date:
- Client Interactions, Last Interaction Date
- Default: is before 180 days ago
