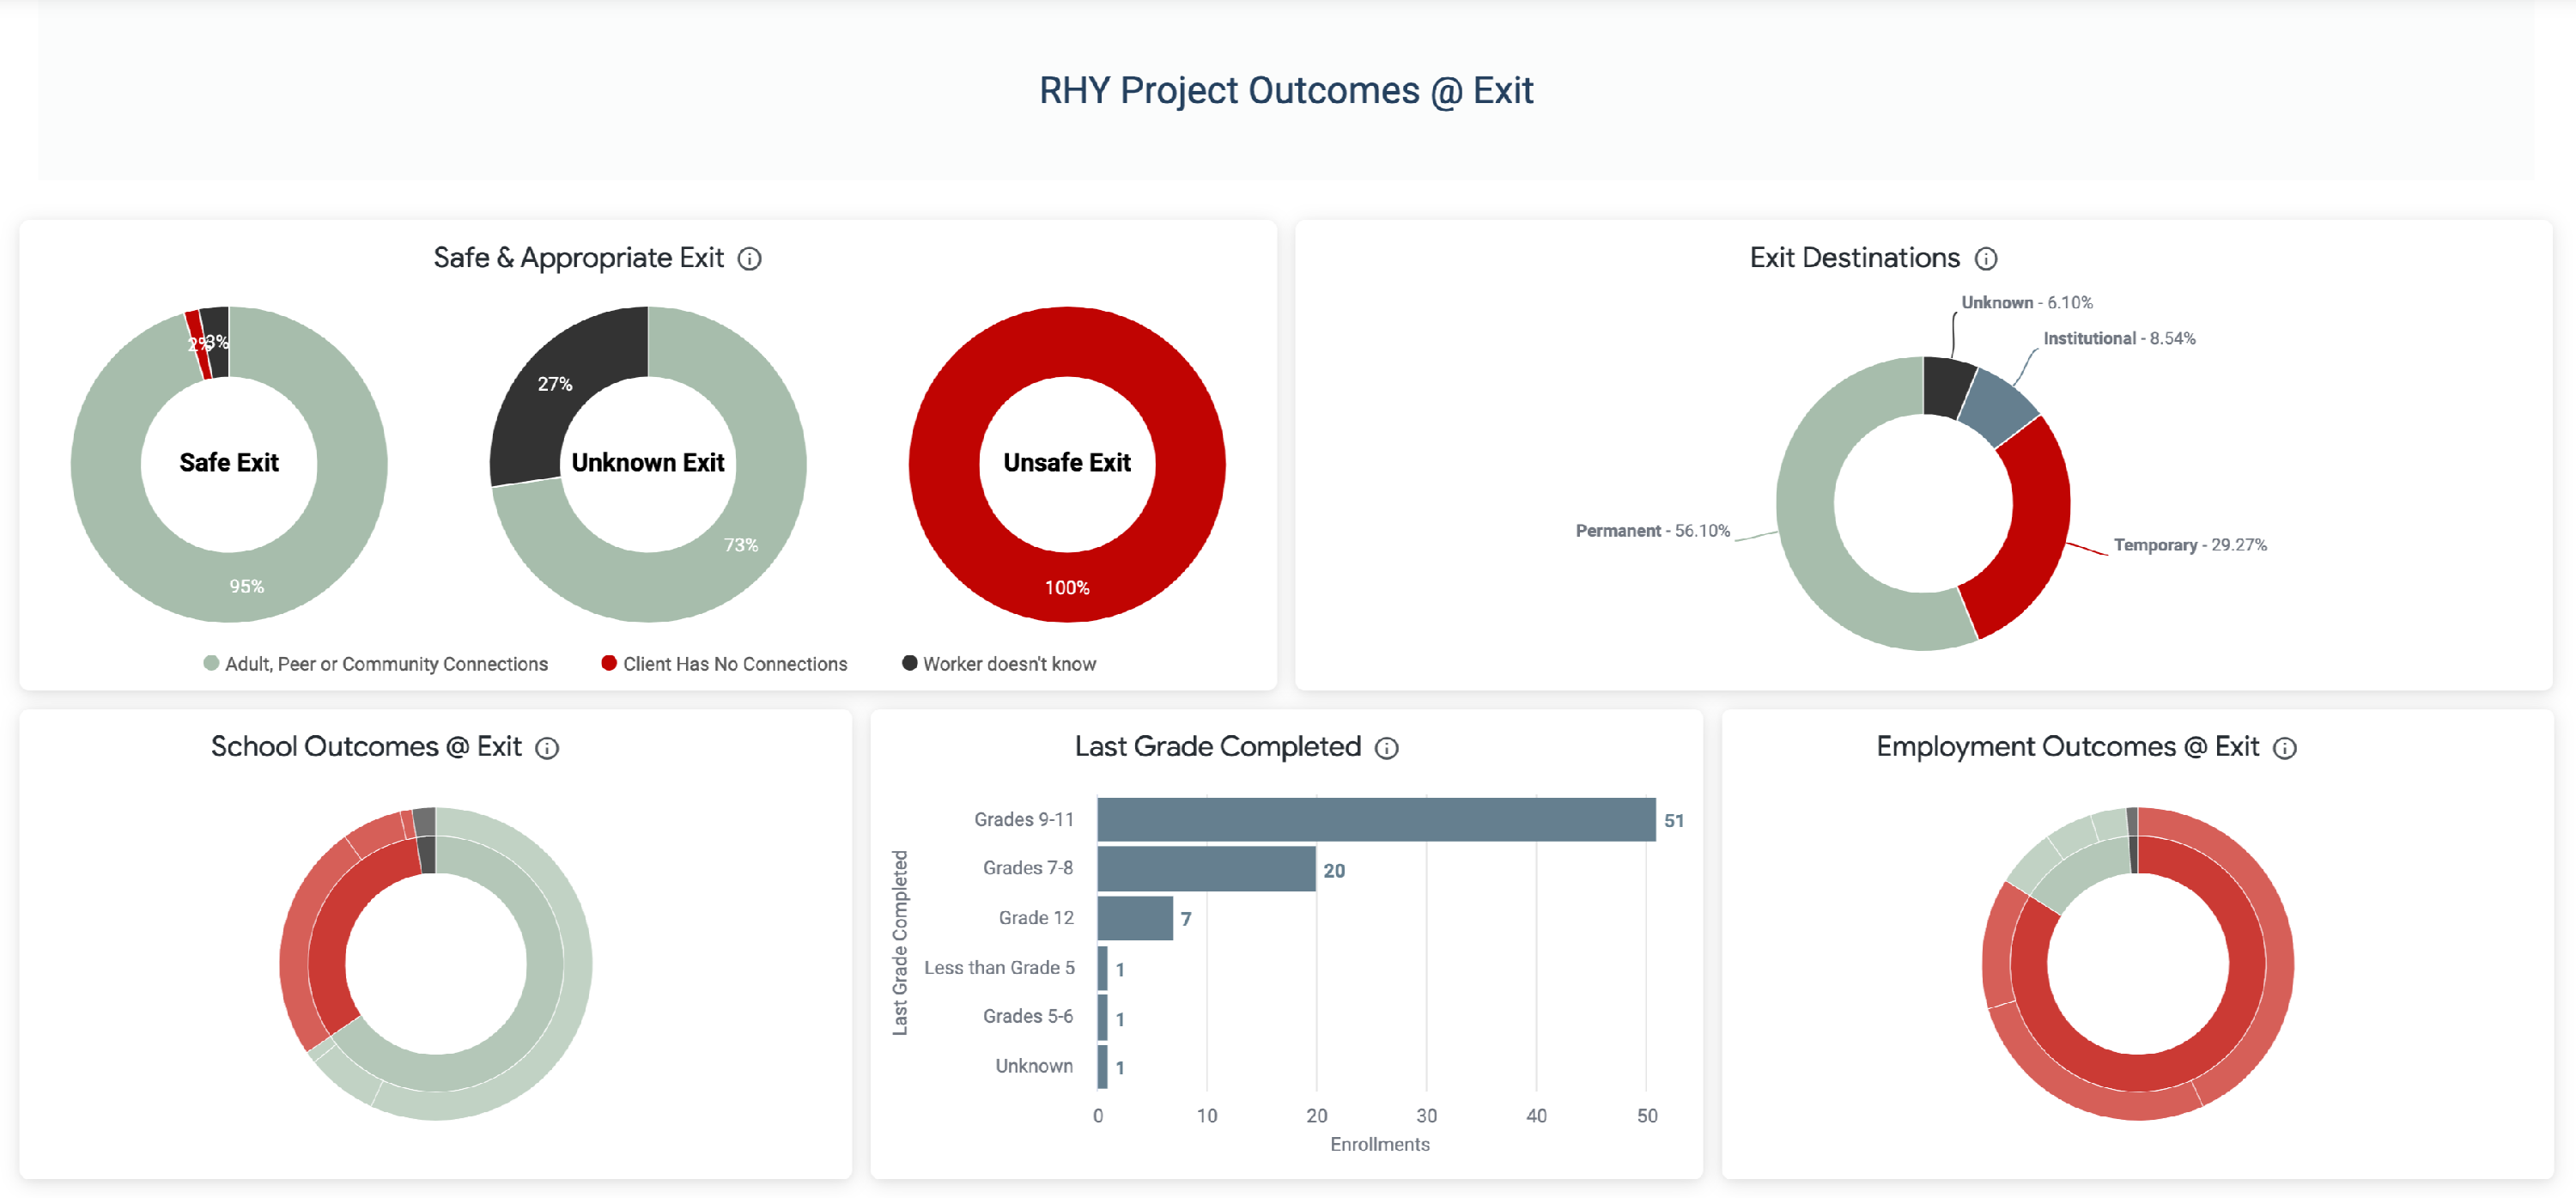
The Runaway and Homeless Youth (RHY) dashboard is a tool for RHY program managers and stakeholders to review the performance of the RHY programs. The dashboard includes outcomes at exit tiles, some participant characteristic tiles and finally some program management tiles. These tiles are useful in preparing to submit the RHY annual report.
Due to the nature of several visualizations, this dashboard is best used for live demonstrations or on-line postings.
Included Tiles
Safe & Appropriate Exit
This tile combines the dimensions from the Safe & Appropriate RHY data element.
Fields
- Custom Dimensions
- Safe Exit - Caseworker - combines unknown responses into "Unknown" group
- if(${last_screen.rhy_dest_safe_caseworker}="Yes", "Safe Exit",
if(${last_screen.rhy_dest_safe_caseworker}="No", "Unsafe Exit", "Unknown Exit"))
-
- Positive Connections Outside of Project - combines the "connections" elements R19.3, R19.4 and R19.5
- if(${last_screen.rhy_adult_connect}="Yes" OR ${last_screen.rhy_community_connect}="Yes" OR ${last_screen.rhy_peer_connect}="Yes", "Adult, Peer or Community Connections",
if(${last_screen.rhy_adult_connect}="No" OR ${last_screen.rhy_community_connect}="No" OR ${last_screen.rhy_peer_connect}="No", "Client Has No Connections",
if(${last_screen.rhy_adult_connect}="Worker doesn't know" OR ${last_screen.rhy_peer_connect}="Worker doesn't know" OR ${last_screen.rhy_community_connect}="Worker doesn't know", "Worker doesn't know", "Client Connections Not Recorded")))
-
-
- Pivot on Positive Connections Outside of Project
-
- Enrollments, Count
Filters
- Enrollments, Reporting Period Filter: is in the past 12 complete months
- Enrollments, Active in Project: is equal to No
- Enrollments, Is Last Enrollment per Program (Yes/No): is Yes
- Program Funding Sources, Funding Source: Is equal to:
- HHS: RHY – Basic Center Program (prevention and shelter)
- HHS: RHY – Maternity Group Home for Pregnant and Parenting Youth
- HHS: RHY – Transitional Living Program
- HHS: RHY – Street Outreach Project
- HHS: RHY – Demonstration Project
- Programs, Project Type Code: Emergency Shelter, Transitional Housing
- Custom Filter:
- ${entry_screen.head_of_household}=yes OR ${entry_screen.age}>=18
Visualization
This tile uses a Donut Multiple visualizations. This type is appropriate for some pivot charts.
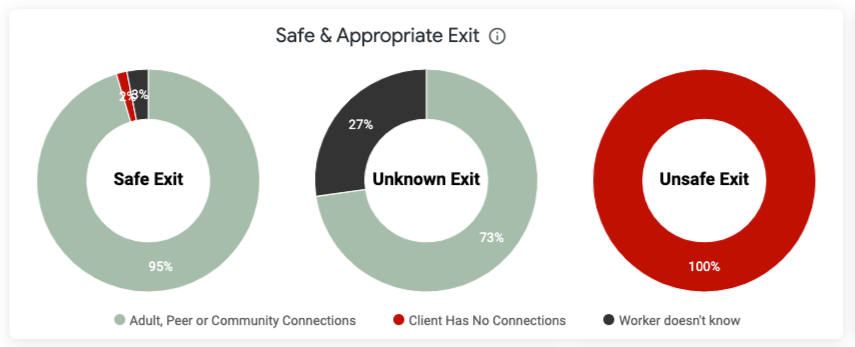
Each donut represents the exit status of the client: Safe, Unknown, or Unsafe. The sections of each donut represent the client's connections outside of the RHY program.:
- Adult, Peer or Community Connections
- Client has No Connections
- Worker doesn't know
Exit Destination
This tile categorizes the recorded exit destinations according to the HUD HMIS designations. (See Appendix A) For destinations that are not included in the annual report, the standard HUD HMIS designations were used.
Fields
- Custom Dimension
- Exit Destinations
- In the formula area of the Custom Dimension screen, paste the following
- Exit Destinations
-
-
-
- if(${last_screen.exit_destination_text}="Emergency shelter, including hotel or motel paid for with emergency shelter voucher, or RHY-funded Host Home shelter", "Temporary",
if(${last_screen.exit_destination_text}="Moved from one HOPWA funded project to HOPWA TH", "Temporary",
if(${last_screen.exit_destination_text}="Transitional housing for homeless persons (including homeless youth)", "Temporary",
if(${last_screen.exit_destination_text}="Staying or living with friends, temporary tenure (e.g. room, apartment or house)", "Temporary",
if(${last_screen.exit_destination_text}="Staying or living with family, temporary tenure (e.g. room, apartment or house)", "Temporary",
if(${last_screen.exit_destination_text}="Place not meant for habitation (e.g., a vehicle, an abandoned building, bus/train/subway station/airport or anywhere outside)","Temporary",
if(${last_screen.exit_destination_text}="Safe Haven", "Temporary",
if(${last_screen.exit_destination_text}="Hotel or motel paid for without emergency shelter voucher", "Temporary",
if(${last_screen.exit_destination_text}= "Foster care home or foster care group home", "Institutional",
if(${last_screen.exit_destination_text}= "Psychiatric hospital or other psychiatric facility", "Institutional",
if(${last_screen.exit_destination_text}= "Substance abuse treatment facility or detox center", "Institutional",
if(${last_screen.exit_destination_text}= "Hospital or other residential non-psychiatric medical facility", "Institutional",
if(${last_screen.exit_destination_text}= "Jail, prison or juvenile detention facility", "Institutional",
if(${last_screen.exit_destination_text}="Long-term care facility or nursing home", "Institutional", if(${last_screen.exit_destination_text}= "Moved from one HOPWA funded project to HOPWA PH", "Permanent",
if(${last_screen.exit_destination_text}= "Owned by client, no ongoing housing subsidy", "Permanent",
if(${last_screen.exit_destination_text}="Owned by client, with ongoing housing subsidy", "Permanent",
if(${last_screen.exit_destination_text}="Permanent housing (other than RRH) for formerly homeless persons", "Permanent",
if(${last_screen.exit_destination_text}="Rental by client, no ongoing housing subsidy", "Permanent",
if(${last_screen.exit_destination_text}="Rental by client, with RRH or equivalent subsidy", "Permanent",
if(${last_screen.exit_destination_text}="Rental by client, with VASH housing subsidy", "Permanent",
if(${last_screen.exit_destination_text}="Rental by client, with GPD TIP housing subsidy", "Permanent",
if(${last_screen.exit_destination_text}="Rental by client, with other ongoing housing subsidy", "Permanent",
if(${last_screen.exit_destination_text}= "Staying or living with family, permanent tenure", "Permanent",
if(${last_screen.exit_destination_text}="Staying or living with friends, permanent tenure", "Permanent",
if(${last_screen.exit_destination_text}="Residential project or halfway house with no homeless criteria", "Other",
if(${last_screen.exit_destination_text}="Deceased","Other",
if(${last_screen.exit_destination_text}="Other","Other",
if(${last_screen.exit_destination_text}="No exit interview completed", "Unknown",
if(${last_screen.exit_destination_text}="Rental by client in a public housing unit", "Permanent",
if(${last_screen.exit_destination_text}= "Rental by client, with HCV voucher (tenant or project based)", "Permanent",
if(${last_screen.exit_destination_text}= "Host Home (non-crisis)", "Temporary",
if(${last_screen.exit_destination_text}="Staying or living in a friend’s room, apartment, or house", "Temporary",
if(${last_screen.exit_destination_text}="Staying or living in a family member’s room, apartment, or house", "Temporary",
if(${last_screen.exit_destination_text}="Worker unable to determine", "Unknown", "Unknown")
)))))))))))))))))
)))))))))))))))))
- if(${last_screen.exit_destination_text}="Emergency shelter, including hotel or motel paid for with emergency shelter voucher, or RHY-funded Host Home shelter", "Temporary",
-
-
- Save
- Enrollments, Count
Filters
- Enrollments, Reporting Period Filter: Is in the past 12 complete months
- Enrollments, Active in Project: Is equal to No
- Enrollments, Is Las Enrollment per Program (Yes/No): Is Yes
- Program Funding Sources, Funding Source: See the RHY funding sources used in Safe & Appropriate Exit
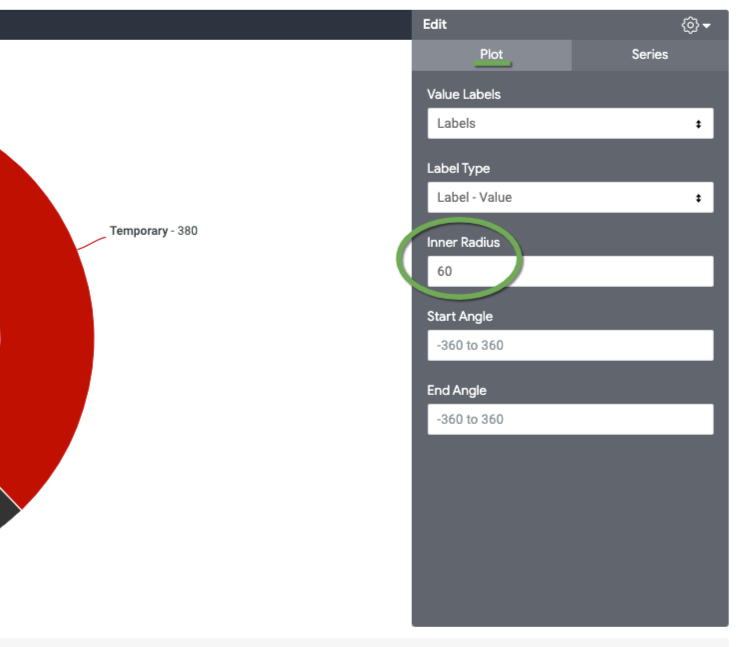
Visualization
This tile is displayed as a donut hole Pie Chart.
To create the donut hole:
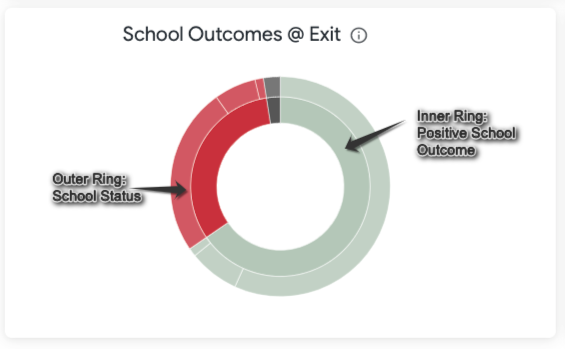
School Outcomes @ Exit
This visualization uses a Sunburst diagram to display related School outcome elements.
Fields
- Custom Dimensions
- Positive School Outcome - Evaluates whether the response to School Status (R5.1) is positive
-
-
- if(${last_screen.rhy_school_status}="Attending school regularly", "Positive School Outcome",
if(${last_screen.rhy_school_status}="Graduated from high school", "Positive School Outcome",
if(${last_screen.rhy_school_status}="Obtained GED", "Positive School Outcome",
if(${last_screen.rhy_school_status}="Attending school irregularly", "Not Positive",
if(${last_screen.rhy_school_status}="Dropped out", "Not Positive",
if(${last_screen.rhy_school_status}="Suspended", "Not Positive",
if(${last_screen.rhy_school_status}="Client doesn't know", "Unknown",
if(${last_screen.rhy_school_status}="Client refused", "Unknown",
if(${last_screen.rhy_school_status}="Data not collected", "Unknown",
if(${last_screen.rhy_school_status}="Expelled", "Not Positive",
if(is_null(${last_screen.rhy_school_status}),"Unknown",${last_screen.rhy_school_status})))))))))))
- if(${last_screen.rhy_school_status}="Attending school regularly", "Positive School Outcome",
-
-
- School Status - Displays School Status details and combines Unknown responses
- if(${last_screen.rhy_school_status}="Client doesn't know"OR ${last_screen.rhy_school_status}="Client refused" OR ${last_screen.rhy_school_status}="Data not collected" OR is_null(${last_screen.rhy_school_status}), "Unknown",${last_screen.rhy_school_status})
- Enrollments, Count
Filters
- Enrollments, Reporting Period Filter: Is in the past 12 complete months
- Enrollments, Active in Project: Is equal to No
- Enrollments, Is Las Enrollment per Program (Yes/No): Is Yes
- Program Funding Sources, Funding Source: See the RHY funding sources used in Safe & Appropriate Exit
- Programs, Project Type Code:
- Emergency Shelter
- Transitional Housing
- Safe Haven
- PH - Housing only
- Homeless Prevention
- PH - Rapid Re-Housing
- Custom Filter
-
- ${entry_screen.head_of_household}=yes OR ${entry_screen.age}>=18
Visualization
The Sunburst diagram is a fairly new offering in Looker. For this tile, the data table is arranged as:
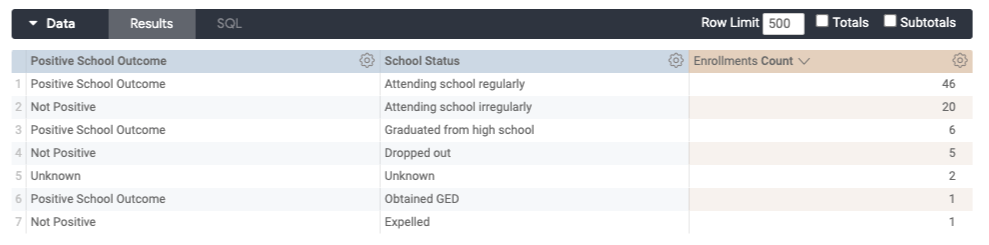
The resulting Sunburst is as follows:
Floating the cursor over a section will display as:
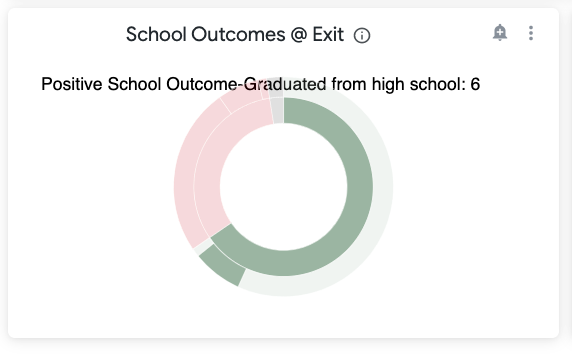
The above shows a Positive School Outcome with 6 Graduating from high school
Last Grade Completed
This tile is a more traditional bar chart.
Fields
- Custom Dimension
- if(${last_screen.rhy_education_level}="Client doesn't know" OR ${last_screen.rhy_education_level}="Data not collected" OR ${last_screen.rhy_education_level}="Client refused" OR is_null(${last_screen.rhy_education_level}), "Unknown", ${last_screen.rhy_education_level})
- Enrollments, Count
Filters
- Enrollments, Reporting Period Filter: Is in the past 12 complete months
- Enrollments, Active in Project: Is equal to No
- Enrollments, Is Las Enrollment per Program (Yes/No): Is Yes
- Program Funding Sources, Funding Source: See the RHY funding sources used in Safe & Appropriate Exit
- Programs, Project Type Code:
- Emergency Shelter
- Transitional Housing
- Safe Haven
- PH - Housing only
- Homeless Prevention
- PH - Rapid Re-Housing
- Custom Filter
-
- ${entry_screen.head_of_household}=yes OR ${entry_screen.age}>=18
Visualization
This is a basic bar chart diagram.
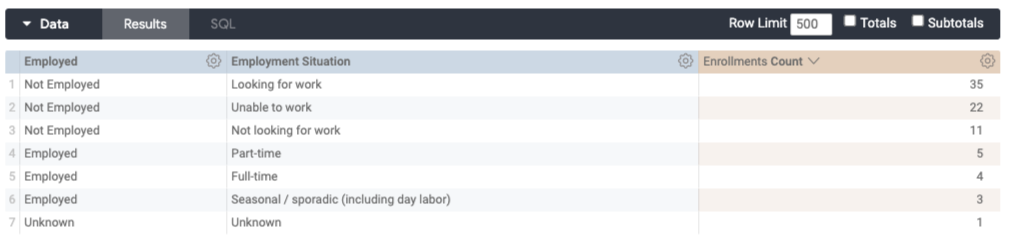
Employment Outcomes @ Exit
This visualization uses a Sunburst diagram to display related Employment outcome elements.
Fields
- Custom Dimensions
- Employed
- if(${last_screen.employed}="Yes", "Employed",
if(${last_screen.employed}="No", "Not Employed",
"Unknown"))
- Employment Situation - This dimension combines Employment Type and Reason Not Employed, depending on the response to Employed
- if(${last_screen.employed}="Yes",${last_screen.rhy_employment_type},
if(${last_screen.employed}="No", ${last_screen.rhy_reason_not_employed},"Unknown"))
- Enrollments, Count
Filters
- Enrollments, Reporting Period Filter: Is in the past 12 complete months
- Enrollments, Active in Project: Is equal to No
- Enrollments, Is Las Enrollment per Program (Yes/No): Is Yes
- Program Funding Sources, Funding Source: See the RHY funding sources used in Safe & Appropriate Exit
- Programs, Project Type Code:
- Emergency Shelter
- Transitional Housing
- Safe Haven
- PH - Housing only
- Homeless Prevention
- PH - Rapid Re-Housing
- Custom Filter
-
- ${entry_screen.head_of_household}=yes OR ${entry_screen.age}>=18
Visualization
This tile also uses a Sunburst diagram. The data should be laid out as shown below:
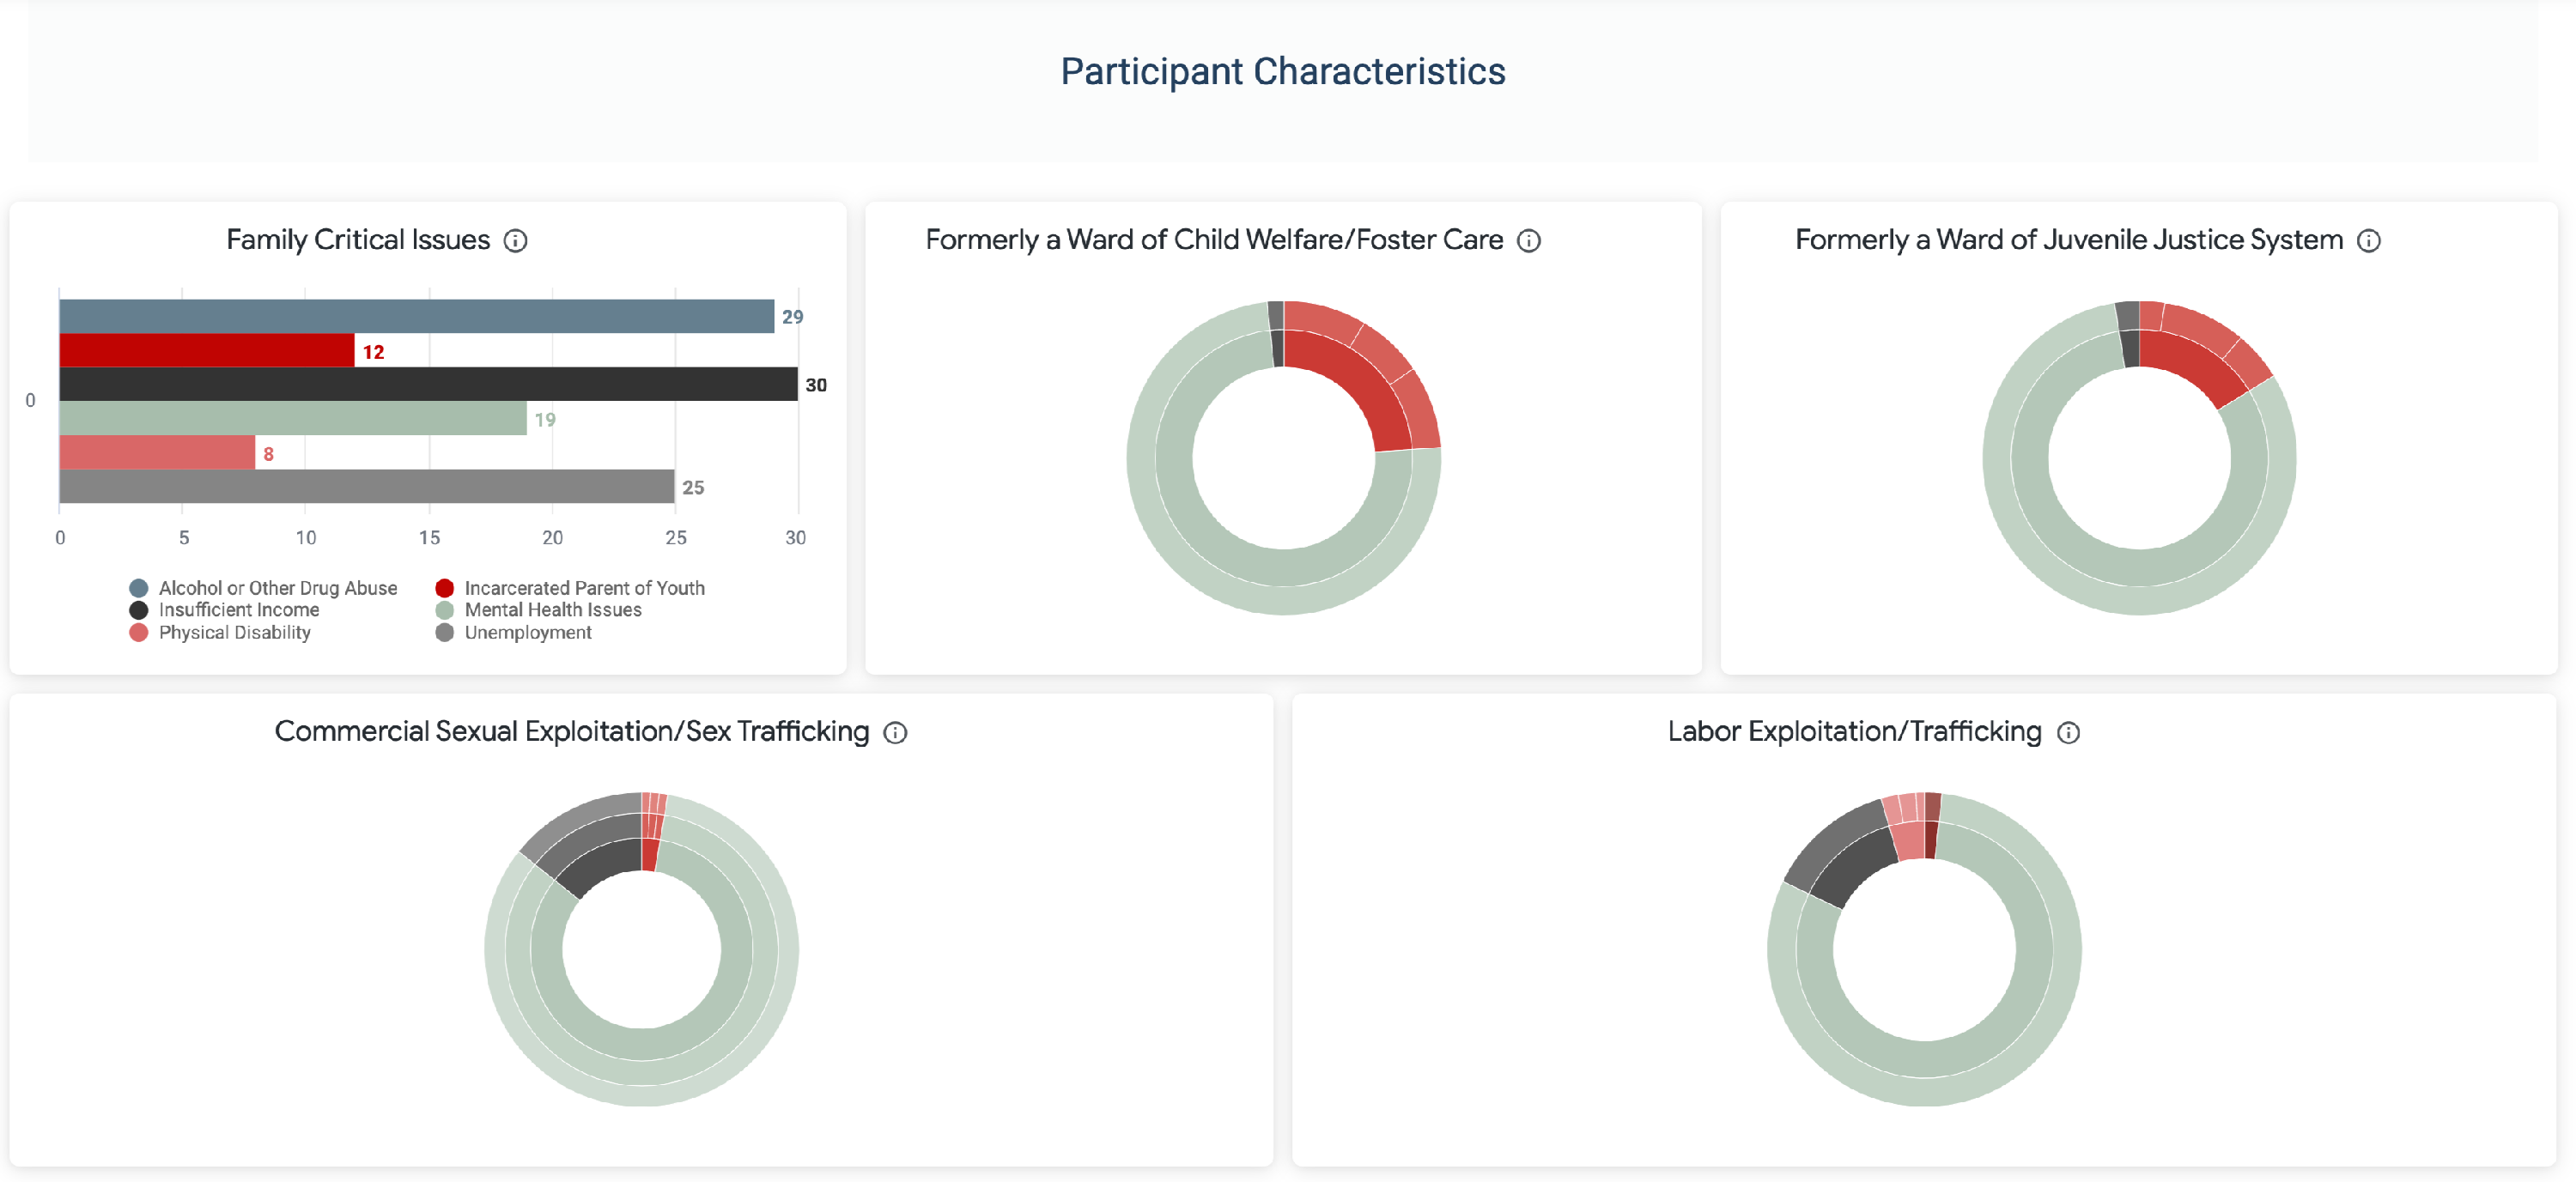
Family Critical Issues
Using the responses to the Family Critical Issues questions, this tile displays how many youths families have these risk factors.
Fields
Fields
- Custom Measures
- Alcohol or Other Drug Abuse
-
-
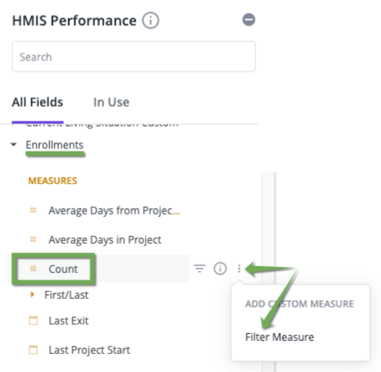
- Under the Enrollments view, Count, click on the gear icon
- Click on Filter Measure
- Change the name to "Alcohol or Other Drug Abuse"Paste the following into the formula area:
-
${entry_screen.rhy_crit_substance_family}="Yes"
-
-
- Save the measure
- Incarcerated Parent of Youth
- Using the same method as above...
-
-
-
-
- ${entry_screen.rhy_crit_substance_family}="Yes"
-
-
-
- Insufficient Income
-
-
- ${entry_screen.rhy_crit_income_family}="Yes"
-
-
- Mental Health Issues
-
-
- ${entry_screen.rhy_crit_mental_family}="Yes"
-
-
- Physical Disability
-
-
- ${entry_screen.rhy_crit_mental_family}="Yes"
-
-
- Unemployment
-
-
- ${entry_screen.rhy_crit_mental_family}="Yes"
-
Filters
- Enrollments, Reporting Period Filter: Is in the past 12 complete months
- Enrollments, Is Las Enrollment per Program (Yes/No): Is Yes
- Program Funding Sources, Funding Source: See the RHY funding sources used in Safe & Appropriate Exit
- Programs, Project Type Code:
- Emergency Shelter
- Transitional Housing
- Homeless Prevention
- Custom Filter
-
- ${entry_screen.head_of_household}=yes OR ${entry_screen.age}>=18
Visualization
This tile uses a simple bar chart for the visualization.
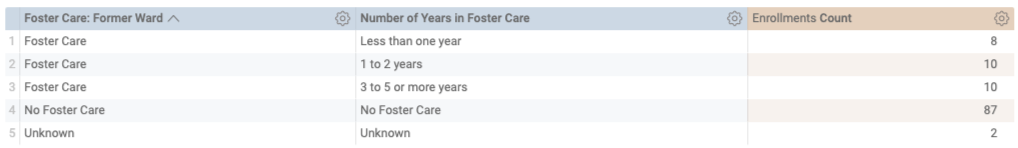
Formerly a Ward of Child Welfare/Foster Care
Fields
- Custom Dimensions
- Former Ward
- Former Ward
-
-
- if(${entry_screen.previous_foster_care}="Yes", "Foster Care",
if(${entry_screen.previous_foster_care}= "No", "No Foster Care","Unknown")
- if(${entry_screen.previous_foster_care}="Yes", "Foster Care",
-
-
- Number of Years in Foster Care
-
-
- if(${foster_care_former_ward}="No Foster Care", "No Foster Care",
if(${foster_care_former_ward}="Unknown", "Unknown", ${entry_screen.rhy_foster_length_years}))
- if(${foster_care_former_ward}="No Foster Care", "No Foster Care",
-
- Enrollments, Count
Filters
- Enrollments, Reporting Period Filter: Is in the past 12 complete months
- Enrollments, Is Las Enrollment per Program (Yes/No): Is Yes
- Program Funding Sources, Funding Source: See the RHY funding sources used in Safe & Appropriate Exit
- Programs, Project Type Code:
- Emergency Shelter
- Transitional Housing
- Homeless Prevention
- Custom Filter
-
- ${entry_screen.head_of_household}=yes OR ${entry_screen.age}>=18
Visualization
The data table for this Sunburst diagram is laid out as follows:
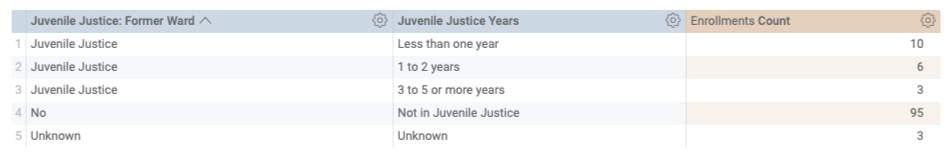
Formerly a Ward of Juvenile Justice System
Fields
- Custom Dimensions
- Juveline Justice: Former Ward
-
-
- if(${entry_screen.rhy_former_justice}="Yes", "Juvenile Justice",
if(${entry_screen.rhy_former_justice}= "No", "No","Unknown"))
- if(${entry_screen.rhy_former_justice}="Yes", "Juvenile Justice",
-
-
- Number of Years in Foster Care
- if(${entry_screen.rhy_former_justice}="Yes", "Juvenile Justice",
if(${entry_screen.rhy_former_justice}= "No", "No","Unknown"))
- if(${entry_screen.rhy_former_justice}="Yes", "Juvenile Justice",
- Number of Years in Foster Care
- Enrollments, Count
Filters
- Enrollments, Reporting Period Filter: Is in the past 12 complete months
- Enrollments, Is Las Enrollment per Program (Yes/No): Is Yes
- Program Funding Sources, Funding Source: See the RHY funding sources used in Safe & Appropriate Exit
- Programs, Project Type Code:
- Emergency Shelter
- Transitional Housing
- Homeless Prevention
- Custom Filter
-
-
- ${entry_screen.head_of_household}=yes OR ${entry_screen.age}>=18
-
Visualization
The data table for this Sunburst diagram is laid out as follows:
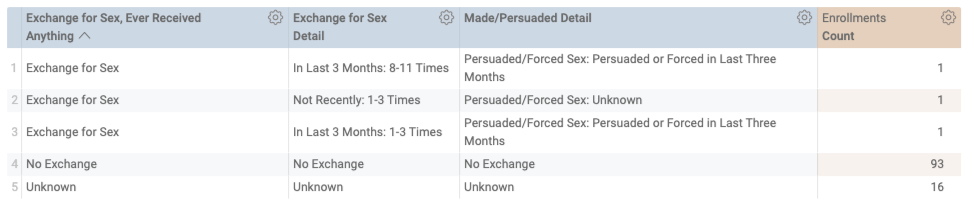
Commercial Sexual Exploitation/Sex Trafficking
This visualization uses combined dimensions from the Sexual Exploitation data elements (R15).
Fields
- Custom Dimensions - Create these dimensions in this order
-
- if(${last_screen.rhy_exploitation}="Yes", "Exchange for Sex",
if(${last_screen.rhy_exploitation}="No", "No Exchange",
"Unknown"))
- if(${last_screen.rhy_exploitation}="Yes", "Exchange for Sex",
-
- if(${last_screen.rhy_exploitation_times}="Yes", "In Last 3 Months",
if(${last_screen.rhy_exploitation_times}="No", "Not Recently",
"Unknown"))
- if(${last_screen.rhy_exploitation_times}="Yes", "In Last 3 Months",
3.Exchange for Sex, Number of Times (R15.1B)
-
- if(${last_screen.rhy_exploitation_frequency}="1-3", "1-3 Times",
if(${last_screen.rhy_exploitation_frequency}="4-7", "4-7 Times",
if(${last_screen.rhy_exploitation_frequency}="8-11", "8-11 Times",
if(${last_screen.rhy_exploitation_frequency}="12 or more", "12 or More Times",
"Unknown"))))
- if(${last_screen.rhy_exploitation_frequency}="1-3", "1-3 Times",
4.Exchange for Sex Detail (Combines R15.1A and R15.1B)
-
- if(${exchange_for_sex_ever_received_anything}="No Exchange", "No Exchange",
if(${exchange_for_sex_ever_received_anything}="Unknown","Unknown",
concat(${exchange_for_sex_in_last_three_months},": ",${exchange_for_sex_number_of_times})))
- if(${exchange_for_sex_ever_received_anything}="No Exchange", "No Exchange",
5.Made/Persuaded/Forced (R15.1C)
-
- if(${exchange_for_sex_ever_received_anything}="No Exchange", "No Exchange",
if(${exchange_for_sex_ever_received_anything}="Unknown","Unknown",
concat(${exchange_for_sex_in_last_three_months},": ",${exchange_for_sex_number_of_times})))
- if(${exchange_for_sex_ever_received_anything}="No Exchange", "No Exchange",
6.Made/Persuaded/Forced In Last Three Months (R15.1D)
-
- if(${last_screen.rhy_exploitation_ask_times}="Yes","Persuaded or Forced in Last Three Months",
if(${last_screen.rhy_exploitation_ask_times}="No","Not Forced Recently",
"Unknown"))
- if(${last_screen.rhy_exploitation_ask_times}="Yes","Persuaded or Forced in Last Three Months",
7. Made/Persuaded Detail (Combines R15.1C and R15.1D)
-
- if(${exchange_for_sex_ever_received_anything}="No Exchange","No Exchange",
if(${exchange_for_sex_ever_received_anything}="Unknown", "Unknown",
concat(${madepersuadedforced},": ",${madepersuadedforced_in_last_three_months})))
- if(${exchange_for_sex_ever_received_anything}="No Exchange","No Exchange",
- Enrollments, Count
Filters
- Enrollments, Reporting Period Filter: Is in the past 12 complete months
- Enrollments, Active in Project: Is equal to No
- Enrollments, Is Las Enrollment per Program (Yes/No): Is Yes
- Program Funding Sources, Funding Source: See the RHY funding sources used in Safe & Appropriate Exit
- Programs, Project Type Code:
- Emergency Shelter
- Transitional Housing
- Homeless Prevention
- Street Outreach
- Custom Filter
-
-
- ${entry_screen.head_of_household}=yes OR ${entry_screen.age}>=18
-
Visualization
Remove the following fields from the data table:
- Exchange for Sex in the Last Three Months
- Exchange for Sex, Number of Times
- Made/Persuaded/Forced
- Made/Persuaded/Forced In Last Three Months
The remaining fields should be in this order for the Sunburst diagram:
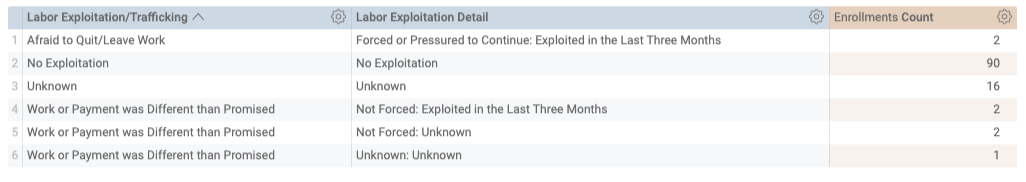
Labor Exploitation/Trafficking
This visualization uses combined dimensions from the Labor Exploitation data elements (R16).
Fields
- Custom Dimensions:
- if(${last_screen.rhy_labor_exploitation_threats}="Yes", "Afraid to Quit/Leave Work",
if(${last_screen.rhy_labor_exploitation_payment}="Yes", "Work or Payment was Different than Promised",
if((${last_screen.rhy_labor_exploitation_threats}="No" OR ${last_screen.rhy_labor_exploitation_payment}="No"), "No Exploitation",
"Unknown")))
2. Forced/Pressured to Continue (R16.1A)
- if(${last_screen.rhy_labor_exploitation_forced_tricked}="Yes","Forced or Pressured to Continue",
if(${last_screen.rhy_labor_exploitation_forced_tricked}="No", "Not Forced",
"Unknown"))
3. Exploited in the Last Three Months (R16.1B)
- if(${last_screen.rhy_labor_exploitation_times}="Yes", "Exploited in the Last Three Months",
if(${last_screen.rhy_labor_exploitation_times}="No","Not Recently",
"Unknown"))Custom Dimension - Create these dimensions in this orderLabor Exploitation Detail (Combines R16.1A and R16.1B)
4. Labor Exploitation Detail
- if(${exchange_for_sex_ever_received_anything}="No Exchange", "No Exchange",
if(${exchange_for_sex_ever_received_anything}="Unknown","Unknown",
concat(${exchange_for_sex_in_last_three_months},": ",${exchange_for_sex_number_of_times})))
- Enrollments, Count
Filters
- Enrollments, Reporting Period Filter: Is in the past 12 complete months
- Enrollments, Active in Project: Is equal to No
- Enrollments, Is Las Enrollment per Program (Yes/No): Is Yes
- Program Funding Sources, Funding Source: See the RHY funding sources used in Safe & Appropriate Exit
- Programs, Project Type Code:
- Emergency Shelter
- Transitional Housing
- Homeless Prevention
- Street Outreach
- Custom Filter
- ${entry_screen.head_of_household}=yes OR ${entry_screen.age}>=18
Visualization
Remove the following fields from the data table:
- Exploited in the Last Three Months
- Forced/Pressured to Continue
The remaining fields should be in this order for the Sunburst diagram:
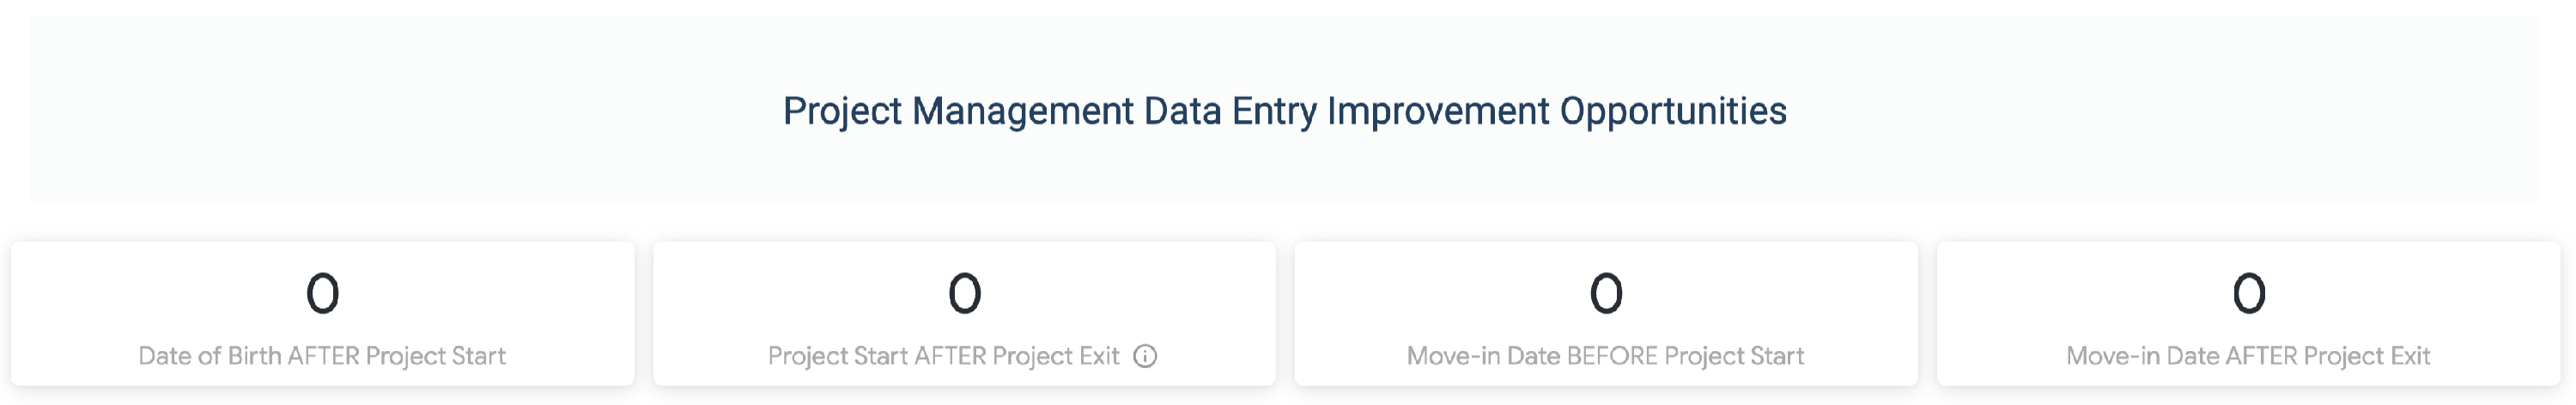
Project Start After Project Exit
This tile returns a count of the number of enrollments that have a Project Start Date greater than the Project Exit date. This problem can occur if a user incorrectly updates the Start Date after the Project Exit has been created. It can also occur during a Data Integration.
Model: HMIS Performance
Fields
- Custom Measure - refer to Family Critical Issues for details on creating custom measures
- Project Start AFTER Project Exit
-
-
- ${enrollments.start_date}>${enrollments.end_date}
-
Filters
- Enrollments, Reporting Period Filter: Is in the past 12 complete months
- Enrollments, Is Las Enrollment per Program (Yes/No): Is Yes
- Program Funding Sources, Funding Source: See the RHY funding sources used in Safe & Appropriate Exit
Visualization
Single Value, likely the default visualization.
DoB AFTER Project Start
This problem usually occurs when there is a birth in the family or when the wrong year is used for the client's date of birth. (for example, the current year)
Fields
- Custom Measure
- Date of Birth After Project Start
- ${clients.birth_date}>${enrollments.start_date}
Filters
- Enrollments, Reporting Period Filter: Is in the past 12 complete months
- Enrollments, Is Las Enrollment per Program (Yes/No): Is Yes
- Program Funding Sources, Funding Source: See the RHY funding sources used in Safe & Appropriate Exit
Visualization
Single Value, likely the default visualization.
Move-in Date AFTER Project Exit
Fields
- Custom Measure
- Move-in Date After Project Start
- Under the Enrollments view, Count, create a custom Filter Measure (see above image)
-
- Paste the following into the formula area
-
-
- ${entry_screen.move_in_date}>${enrollments.end_date}
-
-
- Save the measure
Filters
- Enrollments, Reporting Period Filter: Is in the past 12 complete months
- Enrollments, Active in Project: Is equal to No
- Enrollments, Is Las Enrollment per Program (Yes/No): Is Yes
- Program Funding Sources, Funding Source: See the RHY funding sources used in Safe & Appropriate Exit
- Entry Screen, Head of Household (Yes / No) is Yes
Visualization
Single Value, likely the default visualization.
Move-in Date Before Project Exit
Fields
- Custom Measure
- Move-in Date Before Project Start
- Under the Enrollments view, Count, create a custom Filter Measure (see above image)
- Paste the following into the formula area
-
-
- ${entry_screen.move_in_date}<${enrollments.start_date}
-
- Save the measure
Filters
- Enrollments, Reporting Period Filter: Is in the past 12 complete months
- Enrollments, Active in Project: Is equal to No
- Enrollments, Is Las Enrollment per Program (Yes/No): Is Yes
- Program Funding Sources, Funding Source: See the RHY funding sources used in Safe & Appropriate Exit
- Entry Screen, Head of Household (Yes / No) is Yes
Visualization
Single Value, likely the default visualization.
Dashboard Filters
- Enrollments, Reporting Period Filter: Is in the Last 12 complete months
- Programs, Program Name: Is any value