Retiring Soon - Updated Recidivism - Returns to Homelessness Coming Soon
"Recidivism - Returns to Homelessness" uses the on board Outbound Recidivism fields available in the data analysis tool. While similar to the HUD System Performance Measures, the Outbound Recidivism fields do not meet all the requirements of the SPM report. This dashboard is not intended to be compared with the SPM.
Included Looks
All the Looks were created using the HMIS Performance Model.
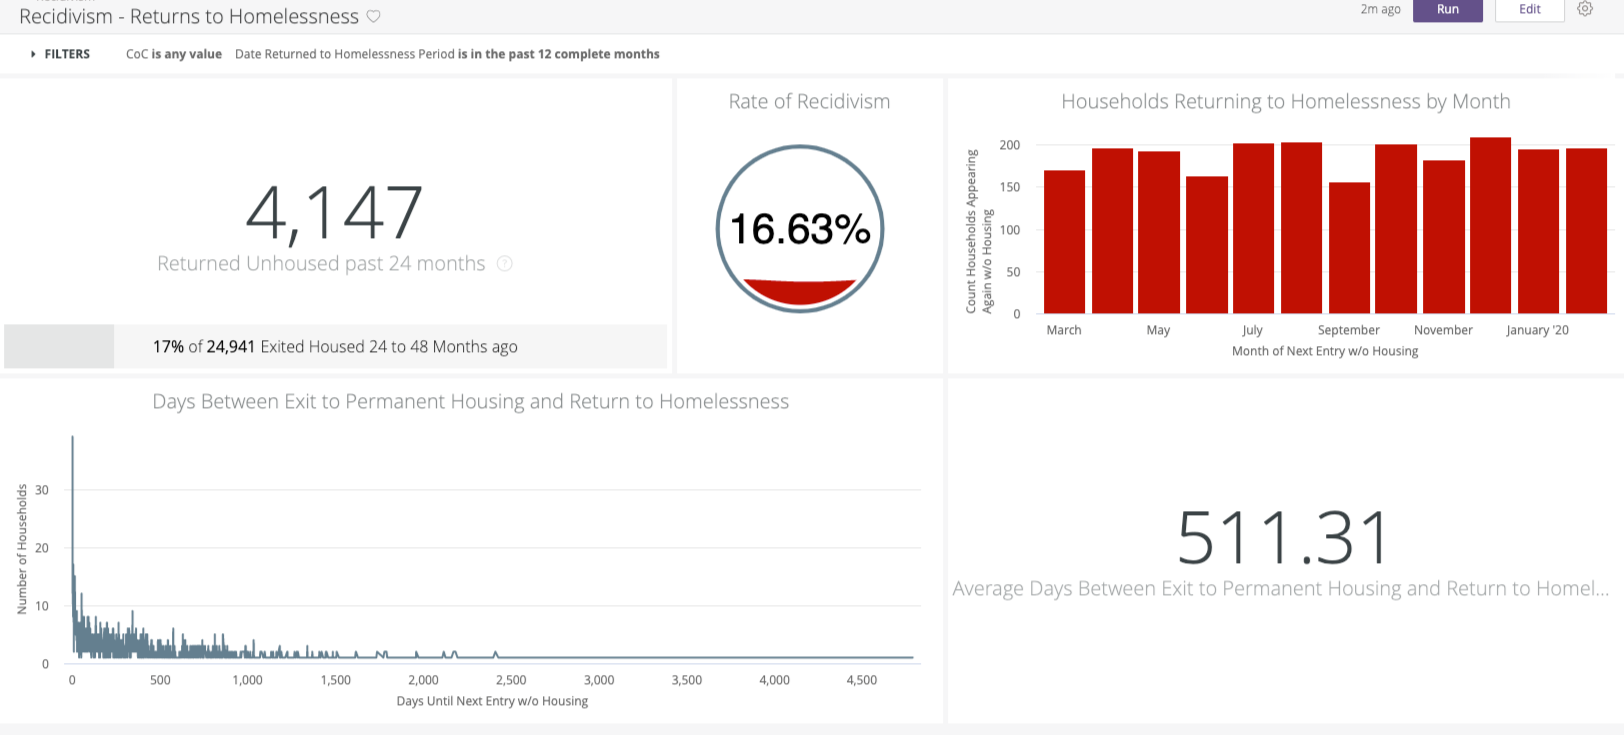
Returned Unhoused past 24 months
This Look displays the number of households that returned to homelessness in the past 24 months. The returning households had previously exited housed between 24 to 48 months ago. The Look also includes a bar showing the percentage of those that return to homelessness.
Fields
- Custom Measures
- Count Households Appear Again w/o Housing past 24 months
- Under the Enrollments view, Count, click on the

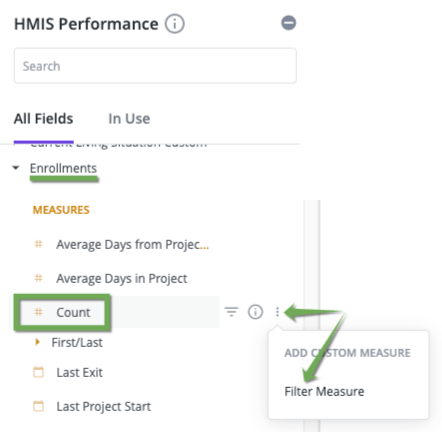
- Click on Filter Measure
- Change the name to "Count Households Appear Again w/o Housing past 24 months" or something similar
- Paste the following into the formula area:
- Under the Enrollments view, Count, click on the
- Count Households Appear Again w/o Housing past 24 months
- diff_days(${outbound_recidivism.next_entry_without_stable_housing_date},
now())<=730
-
-
- Save the Measure
- Count Households Housed on Exit - Past 24 - 48 Months
- Using the same method, create another custom measure on the Enrollments Count
- Paste the following into the formula area:
-
-
-
-
- ${last_screen.housed_on_exit}="housed" AND
(diff_days(${enrollments.end_date}, now())<=1460 AND diff_days(${enrollments.end_date}, now())>=730)
- ${last_screen.housed_on_exit}="housed" AND
-
-
- Save the Measure
Filters
- Reporting Period Filter, Enrollments - Is Any Time
- Head of Household (Yes/No), Enrollments - Is Yes
Visualization
It is very important the columns are in the order shown below.

- Single Value Visualization

- Set up comparison as shown:

Rate of Recidivism
Make a copy of "Returned Unhoused past 24 months" Look.
Additional Field
- Table Calculation
- Rate of Recidivism
-
-
- (${count_households_appear_again_wo_housing_past_24_months}/${count_households_housed_on_exit_past_24_48_months})*100
-
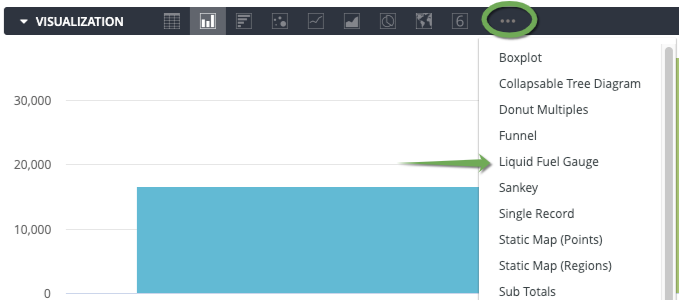
Visualization
Change the visualization to Liquid Fuel Gauge:
Households Returning to Homelessness by Month
Fields
- Dimension
- Next Entry Without Stable Housing Month, Outbound Recidivism
- Measure
- Count Clients Appears Again Without Stable Housing, Outbound Recidivism
Filters
- Reporting Period Filter, Enrollments - Is Any Time
- Head of Household (Yes/No), Enrollments - Is Yes
- Next Entry Without Stable Housing Date, Outbound Recidivism - Is in the past 12 complete months
Visualization
This Look uses a simple column chart.
Days Between Exit to Permanent Housing and Return to Homelessness
Fields
- Dimension
- Days Until Next Entry Without Stable Housing, Outbound Recidivism
- Measure
- Number of Clients, Clients
Filters
- Reporting Period Filter, Enrollments - Is Any Time
- Head of Household (Yes/No), Enrollments - Is Yes
- Next Entry Without Stable Housing Date, Outbound Recidivism - Is in the past 12 complete months
Visualization
This Look using a Line chart. No additional modifications were used.
Average Days Between Exit to Permanent Housing and Return to Homelessness
Fields
- Average Days Until Next Entry Without Stable Housing, Outbound Recidivism
Filters
- Reporting Period Filter, Enrollments - Is Any Time
- Head of Household (Yes/No), Enrollments - Is Yes
- Next Entry Without Stable Housing Date, Outbound Recidivism - Is in the past 12 complete months
Visualization
This Look uses a Single Value display.
Dashboard Filters
- CoC - Program CoC
- Date Returned to Homelessness Period - Next Entry Date
- Default: is in the past 12 complete months
- Does not affect "Returned Unhoused past 24 months" and "Rate of Recidivism"