The dashboards designed around race and ethnicity equity are inspired by the NAEH Racial Equality Network ToolKit. The following describes each Look that is part of the suite of equity dashboards.
All of these Looks were built in the HMIS Performance model.
Distribution Looks
The strategy of this collection of Looks shows a particular situation or outcome and the breakdown by Race or Ethnicity.
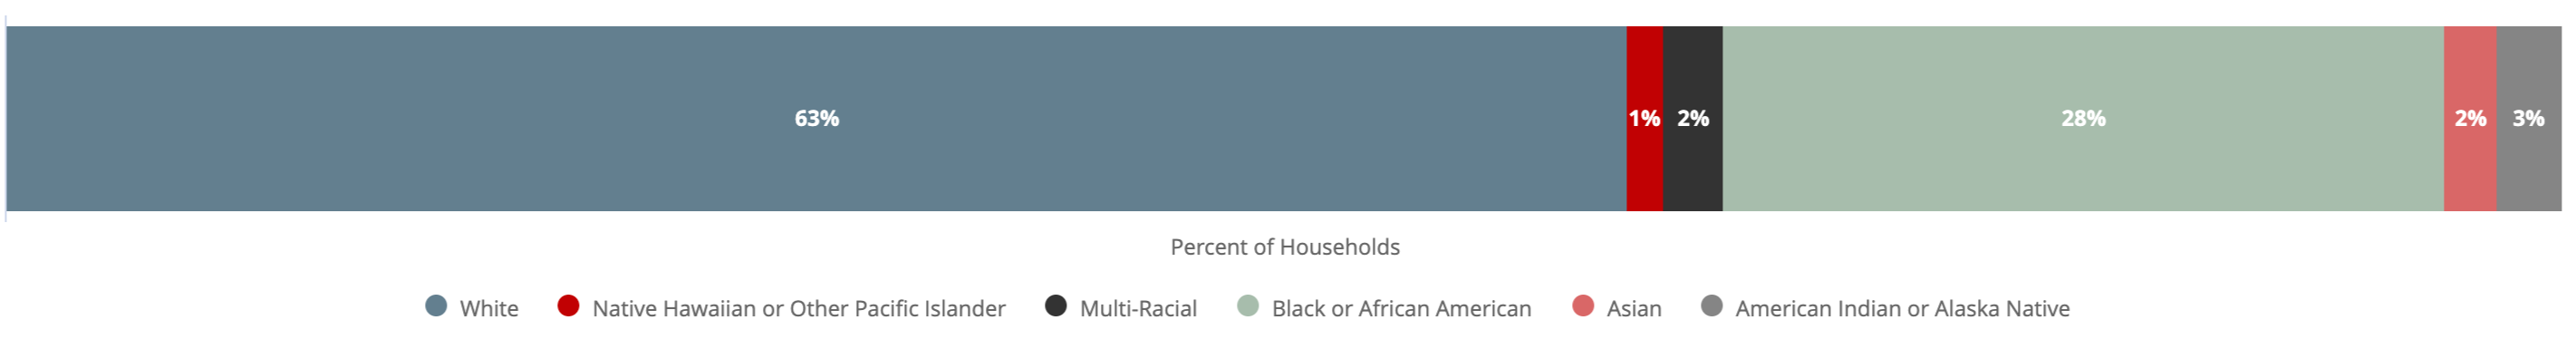
Experience of ELI Poverty
By race or ethnicity, the percentage of households experiencing Extremely Low Income poverty, based on Area Median Income.
Fields
- Area Median Income, Update/Exit Screen
- Count Households, Enrollments
- Pivot on Race/Clients
Filters
- Reporting Period Filter
- Race, Clients
- is not equal to:
- Client doesn't know
- Client refused
- Data not collected
- AND is not null
- is not equal to:
- Area Median Income, Update/Exit Screen is Extremely Low
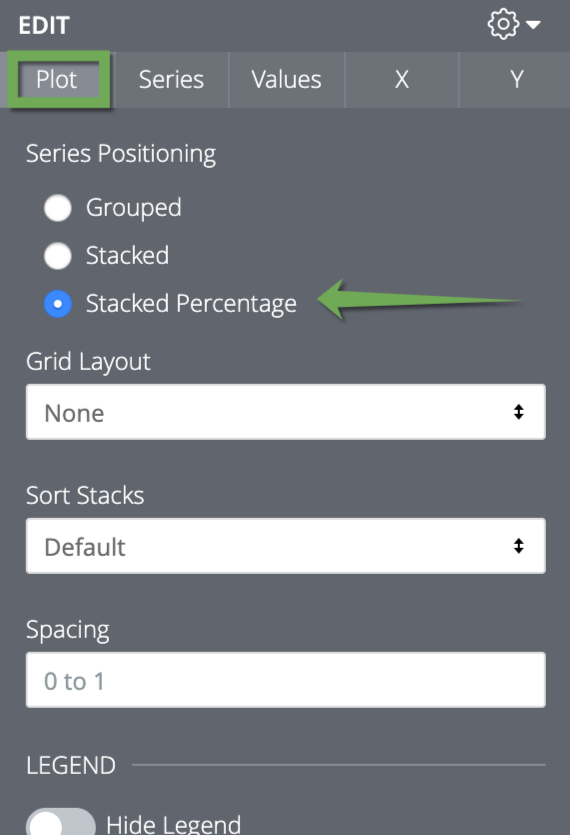
Visualization
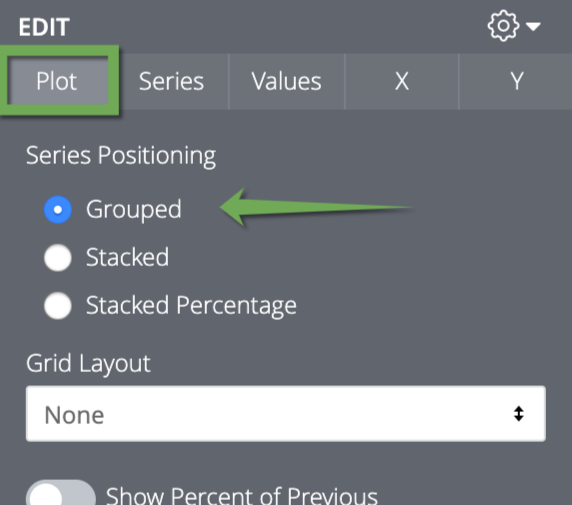
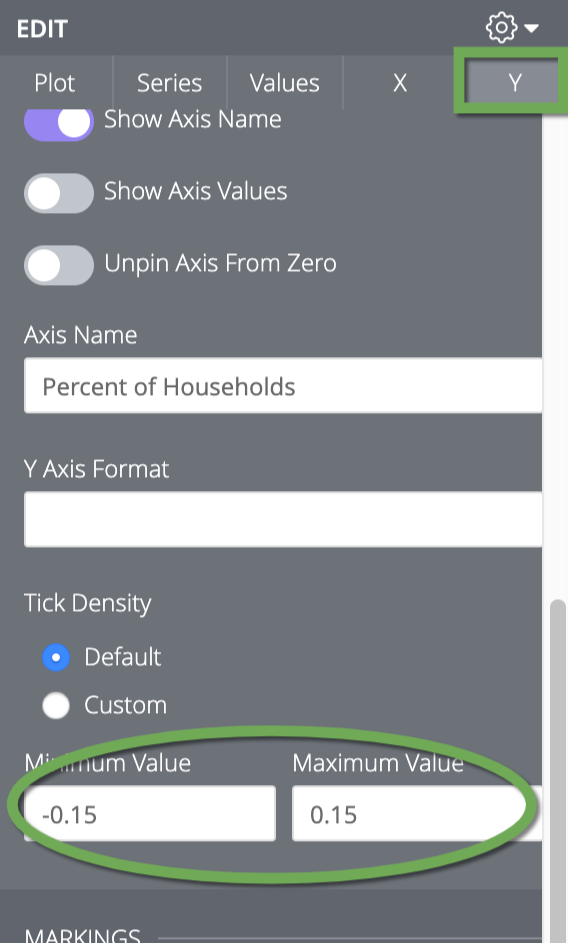
The chosen visualization is Bar chart. From there, choose the following option
Experience of Homelessness
By race, the percentage of households enrolled in a homeless program: Emergency Shelter, Safe Haven, Street Outreach.
Fields
Start with the "Experience of ELI Poverty" Look and remove the Area Median Income from the Data Table and Filters.
Filters
- Add Project Type Code, Programs is equal to:
- Emergency Shelter
- Safe Haven
- Street Outreach
Visualization
No additional changes are needed for the visualization.
Enrollment in PH Program
By race or ethnicity, percentage of households enrolled in Permanent Housing programs: Permanent Supportive Housing, Rapid Re-Housing, and all other permanent housing project types.
Fields
Start with the "Experience of Homelessness" Look.
Filters
Change the Project Type Code filter to:
- PH - Housing Only
- PH - Housing with Services
- PH - Permanent Supportive Housing
- PH - Rapid Re-Housing
Visualization
No additional changes are needed for the visualization.
Positive Housing Outcome
By race or ethnicity, of those enrolled in PH program, percentage of households that move into permanent housing or had an exit destination of permanent housing.
Fields
Start with the "Enrollment in PH Program" Look.
Filters
Create a Custom Filter:
Use the following code for the custom filter:
(NOT is_null(${enrollments.end_date}) AND ${last_screen.housed_on_exit}="Housed")
OR (is_null(${enrollments.end_date}) AND NOT is_null(${enrollments.latest_move_in_date}))
Visualization
No additional changes are needed for the visualization.
Equity Looks
The strategy of the Equity Looks takes the difference between race equity distribution of two outcomes or situations. For example: (% Enrollments in PH projects) - (% All Homeless Households).
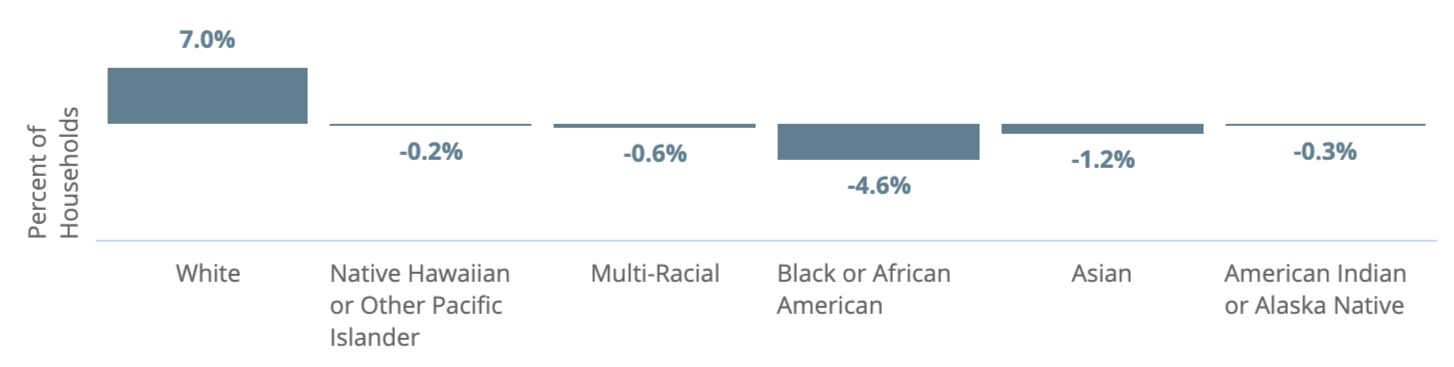
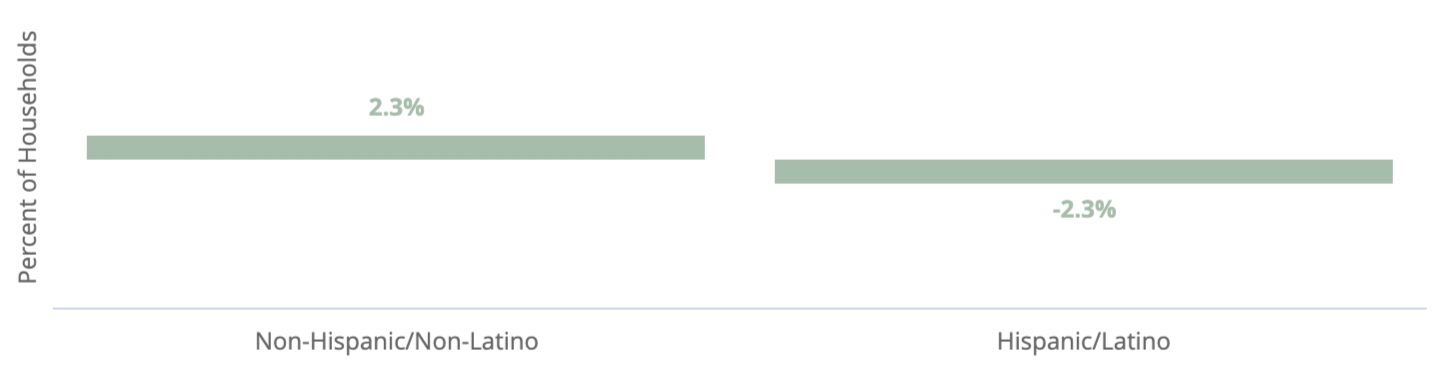
Difference between Homelessness and ELI Poverty
(Experience of Homelessness Distribution) - (Experience of ELI Poverty)
Fields
- Race, Clients
- Custom Measures:
- Exp Poverty:
- Field to measure: Count Households
- Measure filter:
- Exp Poverty:
-
-
-
- ${household_exit_screen.area_median_income}="Extremely Low Income (<30% AMI)"
-
-
Exp Homelessness:
-
-
- Field to measure: Count Households
- Measure filter:
-
-
-
-
- ${programs.project_type_code}="Emergency Shelter" OR
${programs.project_type_code}="Safe Haven" OR
${programs.project_type_code}="Street Outreach"
- ${programs.project_type_code}="Emergency Shelter" OR
-
-
- Table Calculations:
- % Poverty:
-
-
- ${exp_poverty}/sum(${exp_poverty})
-
-
- % Homelessness:
-
-
- ${exp_homelessness}/sum(${exp_homelessness})
-
-
- Difference:
-
-
- ${homelessness}-${poverty}
-
-
- Hide the following fields from the visualization:
- Exp Poverty
- Exp Homelessness
- % Poverty
- % Homelessness
Filters
- Reporting Period Filter, Enrollments
- Race, Clients
- is not equal to:
- Client doesn't know
- Client refused
- Data not collected
- AND is not null
- is not equal to:
Visualization
The chosen visualization is Column chart. From there, choose the following options:
Difference Between Enrollment in PH and Homelessness
(Enrollment in PH Distribution) - (Experience of Homelessness Distribution)
Fields
Start with the "Difference between Homelessness and ELI Poverty" Look.
Remove/Delete the following fields:
- Exp Poverty
- % Poverty
Add:
- Custom Measure:
- PH Enrollments
- Field to measure: Count Households
- Measure filter:
- PH Enrollments
-
-
-
- ${programs.project_type_code}="PH - Housing Only" OR
${programs.project_type_code}="PH - Housing with Services (no disability required)" OR
${programs.project_type_code}="PH - Permanent Supportive Housing (disability required)" OR
${programs.project_type_code}="PH - Rapid Re-Housing"
- ${programs.project_type_code}="PH - Housing Only" OR
-
-
- Table Calculation:
- % PH Enrollments
-
-
- ${ph_enrollments}/sum(${ph_enrollments})
-
Edit:
- Table Calculation "Difference":
-
- ${ph_enrollments_3}-${exp_homelessness_2}
Filters
No additional changes are needed.
Visualizations
No additional changes are needed.
Difference Between Positive Housing Outcome and Enrollments in PH
(Positive Housing Outcome Distribution) - (Enrollment in PH Distribution)
Fields
Start with the "Difference Between Enrollment in PH and Homelessness" Look
Remove/Delete the following fields:
- Exp Homelessness
- % Homelessness
Add:
- Custom Measure:
- Housed on Exit or Moved-in
- Field to measure: Count Households
- Measure filter:
- Housed on Exit or Moved-in
-
-
-
- (NOT is_null(${enrollments.end_date}) AND ${last_screen.housed_on_exit}="Housed")
OR (is_null(${enrollments.end_date}) AND NOT is_null(${enrollments.latest_move_in_date}))
- (NOT is_null(${enrollments.end_date}) AND ${last_screen.housed_on_exit}="Housed")
-
-
- Table Calculation:
- % Housed
-
-
- ${housed_on_exit_or_moved_in}/sum(${housed_on_exit_or_moved_in})
-
Edit:
- Table Calculation "Difference"
-
- ${housed}-${ph_enrollments_2}
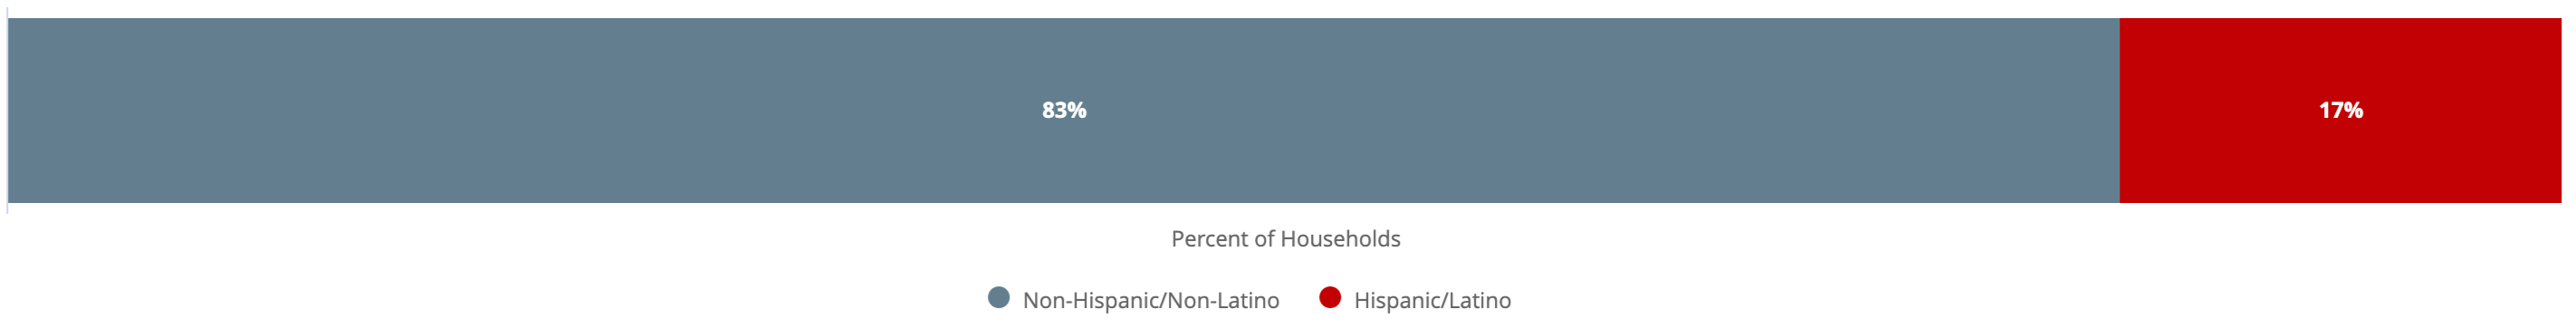
Ethnicity Looks
The Ethnicity Looks follow the same strategy as the Race Distribution and Equity Looks. Simply use "Ethnicity, Clients" instead of "Race". Filter out the Don't Know/Refused responses for Ethnicity.