- Clarity Human Services Help Center
- HUD and Federal Partner Resources
- 2024 Data Standards
-
New Clarity Human Services Interface
-
News and Announcements
-
Getting Started
- Accessing Clarity Human Services
- Client Records and Households
- Program Enrollments
- Managing Client Data in Screens
- Services
- Entering Client Location Data
- Contact Tab, Files Tab, and Notes Tab
- Charts and Goals
- The Attendance Module
- Working with the Referrals Tab and Community Queues
- Recording and Managing Referrals in the Client Record
-
Clarity Human Services: Customer Portal
-
Clarity Human Services: INVENTORY
-
Clarity Human Services: Outreach
-
System Administration
-
HUD and Federal Partner Resources
-
Agency Management
-
Coordinated Entry
-
Report Library
-
Data Analysis
-
Data Integration and Migration
-
Submit a Request
-
System Status
-
COVID-19 Resources
Dashboards - New Features May 2020
This article describes the changes users will encounter following an upgrade to new dashboard features.
Overview of Changes
New User Interface
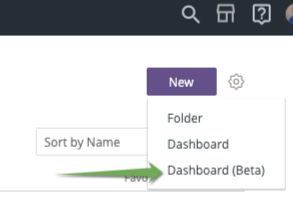
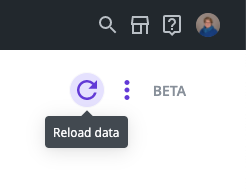
To begin a dashboard using the new features, select "Dashboard (beta)."
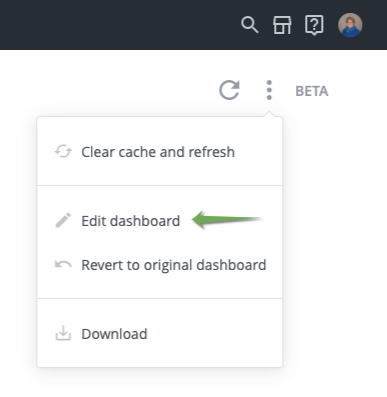
- Click "Edit Dashboard" to begin adding content
- New Looks can be created and added to the dashboard by clicking on "Add Tile"
- To add existing Looks, close the dashboard returning to the folder with the Looks
- Open the Look
- Using the
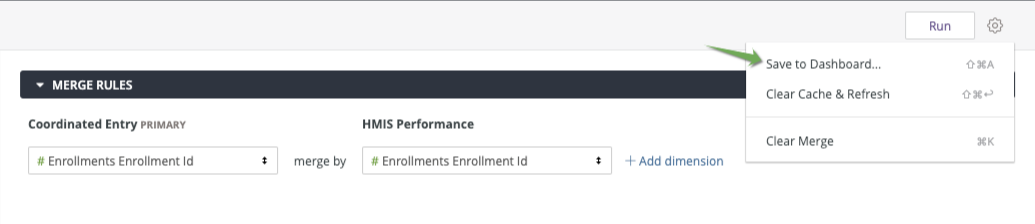
 , "Save to Dashboard"
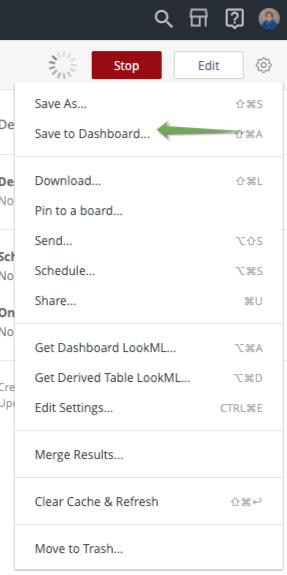
- Navigate to the appropriate folder for the dashboard
- NOTE: Looks can now be added to dashboards from any folder or space
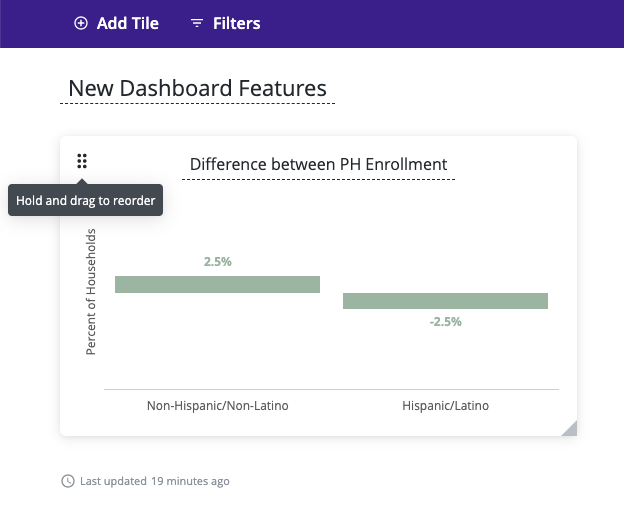
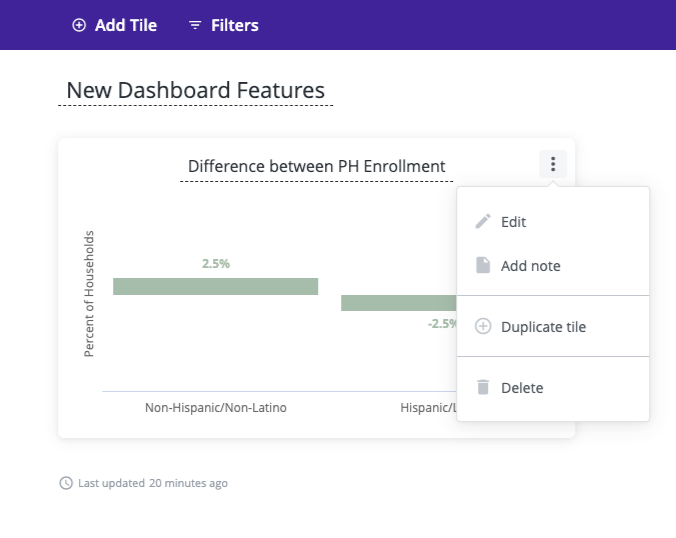
Looks added to dashboards will now display as a tile, with an offset shadow around the tile.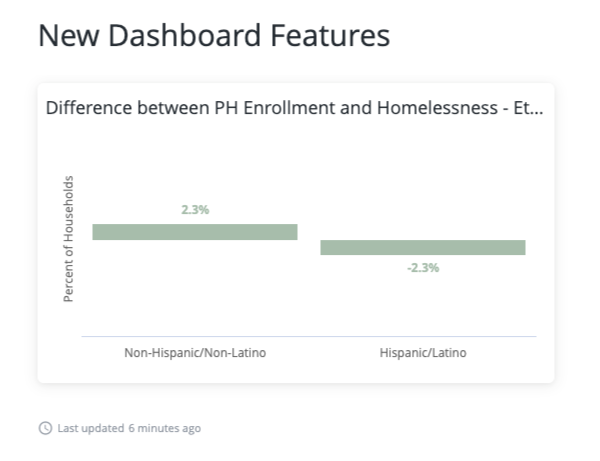
Navigation
1. 
2. 
3. 
Moving and resizing the tiles
Converting from Legacy to Beta Dashboard Version
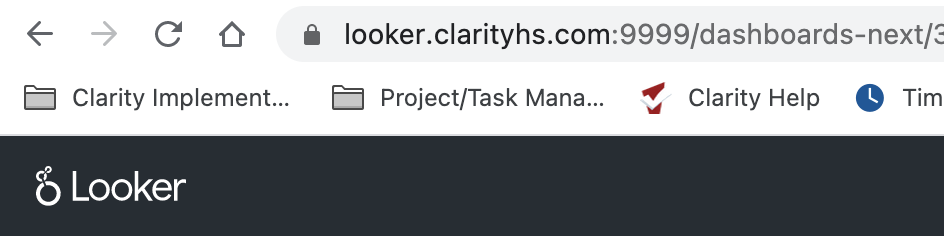
To temporarily convert a dashboard to the new Beta version, in the URL, change "dashboards" to "dashboards-next."
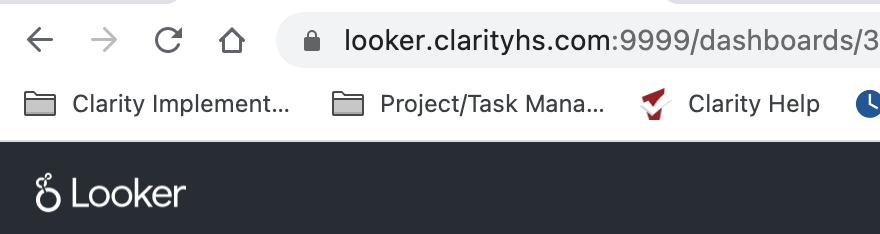 >>>
>>> 
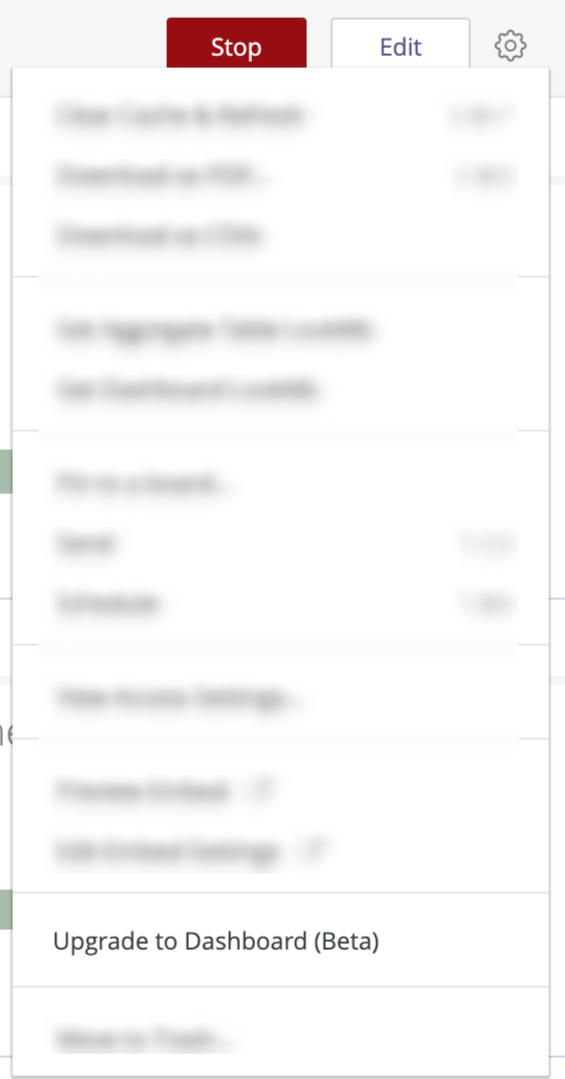
To permanently change a dashboard, from the dashboard gear ![]() , select "Upgrade to Dashboard (Beta)
, select "Upgrade to Dashboard (Beta)
Visual Drilling
The data analysis tool now has the capability to show more than a table when drilling through a data point.
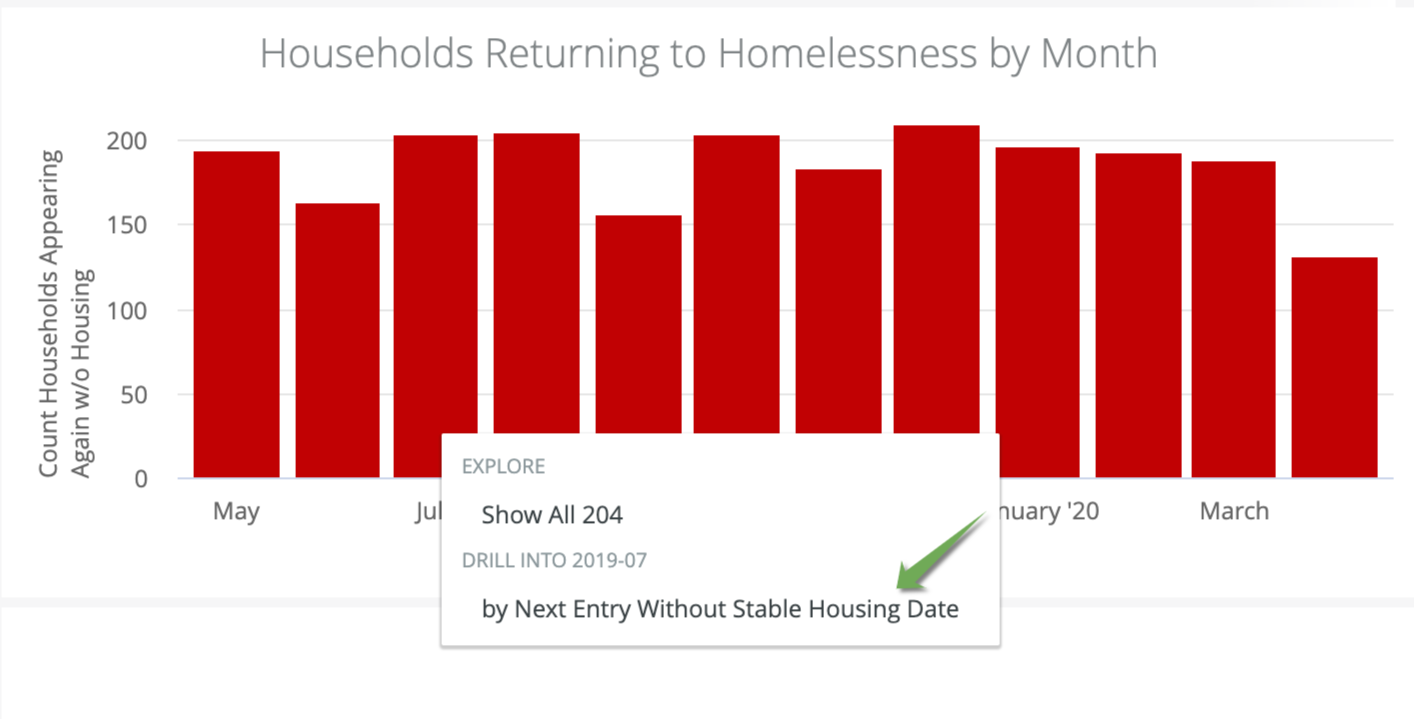
When a visualization is available, there will be the option to "Drill Into..." beyond the "Explore" option which will display a data table.
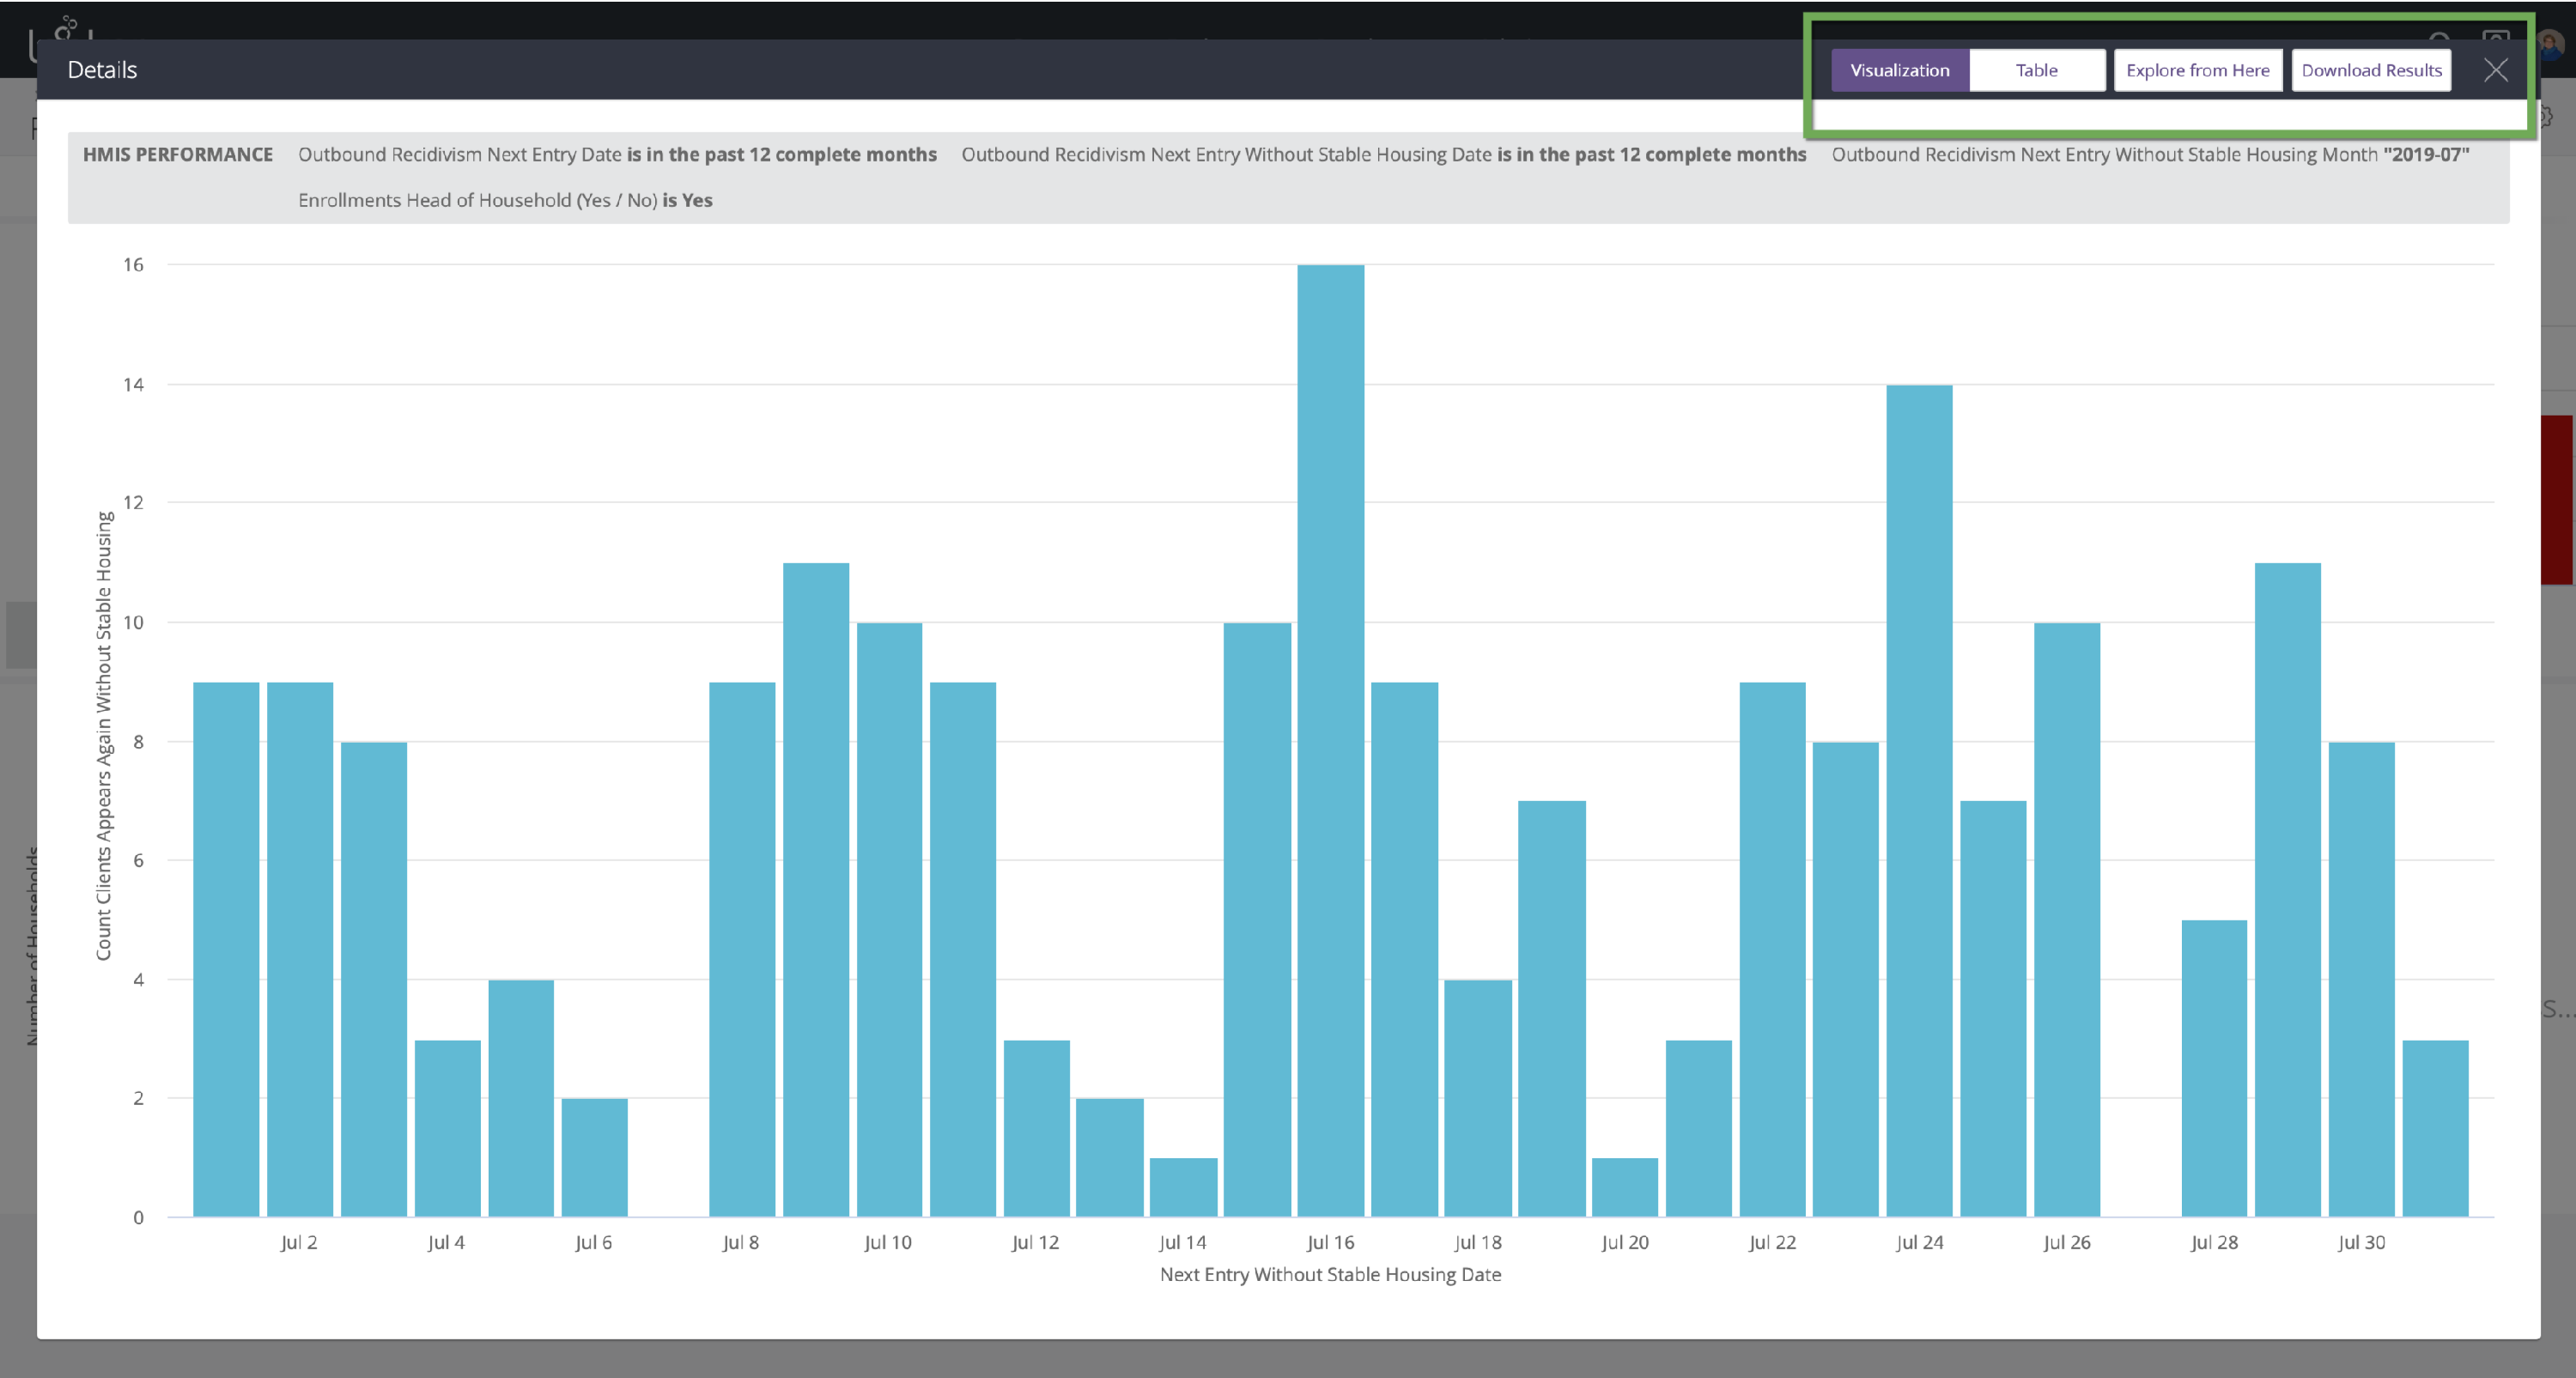
The resulting drill overlay will display a visualization that best represents the underlying data. In addition to the visualization the user can:
- View the Table
- Explore from Here
- Download Results
Merged Results
Visualizations from a merged results query can now be saved to dashboards. Once the visualization is prepared, simply save to dashboard.