Purpose
The Coordinated Entry Matchmaker and Stakeholder Dashboards provide information and insight about your Coordinated Entry (CE) system. Highlighting 13 looks and a client detail table, the Coordinated Entry Matchmaker and Stakeholder LookML dashboards can start data driven initiatives, assist in facilitation of systems planning conversations, and motivate data analysis and evaluation in addition to assisting with the ins and outs of the CE process.
There are two dashboards for Coordinated Entry that will be discussed in this article - the Coordinated Entry Matchmaker and Stakeholder Dashboard and the Coordinated Entry Matchmaker and Stakeholder Dashboards - No Wrong Door Dashboard. The dashboards contain the same tiles and utilize the same Coordinated Entry model.
There are only two differences between these two dashboards.
- The logic for the client universes/who is pulled into the report differs to highlight two different styles of CE.
- The filters at the top of the dashboards also slightly differ - an overview of these filters can be found in this article.
The No Wrong Door dashboard is unique because all Coordinated Entry data for your CoC can be accessed in one place. A centralized data visualization even when your CE programs may be spread out. This dashboard is tailored for communities that use the “No Wrong Door” CE model meaning clients can go to any project and be assessed for housing.
Be careful when selecting the Coordinated Entry Matchmaker and Stakeholder dashboards and ensure you are choosing the correct model for your needs.
To better understand the basics of the Coordinated Entry data analysis model, please review the Coordinated Entry Model Help Center article.
To get the best results with this dashboard and the Coordinated Entry model, the CE system should follow the guidelines described in Coordinated Entry Data Standards Readiness Assessment.
Dashboard Details
This dashboard is accessible in Looker by utilizing the following pathway:
“All Folders”-
- “LookML Dashboards”
- “Coordinated Entry Matchmaker & Stakeholder” OR
- “Coordinated Entry Matchmaker & Stakeholder - No Wrong Door”
- “LookML Dashboards”
Once selected, your dashboard will begin to run.
This dashboard predominantly utilizes the Coordinated Entry model. The only exception is Occupied PH Beds which utilizes the HMIS Performance model.
Filters
Note: The filters for each dashboard differ slightly. Please, review carefully.
The table below includes the filters for both dashboards for reference. These filters can be updated for further analysis when reviewing the dashboard.
Dashboard View

Filter Overview
|
Filter Name |
Coordinated Entry Matchmaker and Stakeholder |
Coordinated Entry Matchmaker and Stakeholder - No Wrong Door |
|
Community Queue Name |
This filter defaults to ‘is any value’. |
This filter defaults to ‘is any value’. |
|
CoC - PH Bed Inventory and Occupancy / Bed and Unit Inventory CoC |
This filter can be used to select a specific CoC depending on your access level. |
This filter can be used to select a specific CoC depending on your access level. |
|
CE Assessment Screen Name |
This filter defaults to ‘is any value’. |
N/A |
|
Move-in Rate and Days to Housing Period |
This filter defaults to “is in the last 12 complete months”. |
This filter defaults to “is in the last 12 complete months”. |
|
CE Enrollment Period |
This filter defaults to “is in the last 12 complete months”. |
N/A |
|
Referral Period |
This filter defaults to “is in the last 12 complete months”. |
This filter defaults to “is in the last 12 complete months”. |
|
Veterans |
This filter defaults to ‘is any value’. |
This filter defaults to ‘is any value’. This filter can be utilized to single or multi-select from the following Veteran Status options: Yes, No, Client doesn’t know, Client refused and Data not collected. |
|
Chronic Homeless |
This filter defaults to ‘is any value’. |
This filter defaults to ‘is any value’. This filter can be utilized to single or multi-select from the following Veteran Status options: Yes, No, Client doesn’t know, Client refused and Data not collected. |
|
Prioritized Date Range |
This filter defaults to “is in the last 12 complete months”. |
N/A |
Tile Overview
The dashboards contain 13 Looks and a client detail list visualizing helpful metrics/statistics calculated from live data in Clarity Human Services. This tile overview will highlight a brief description of each tile, the dimensions and measures used and what to expect when “Explore the Look” is selected.
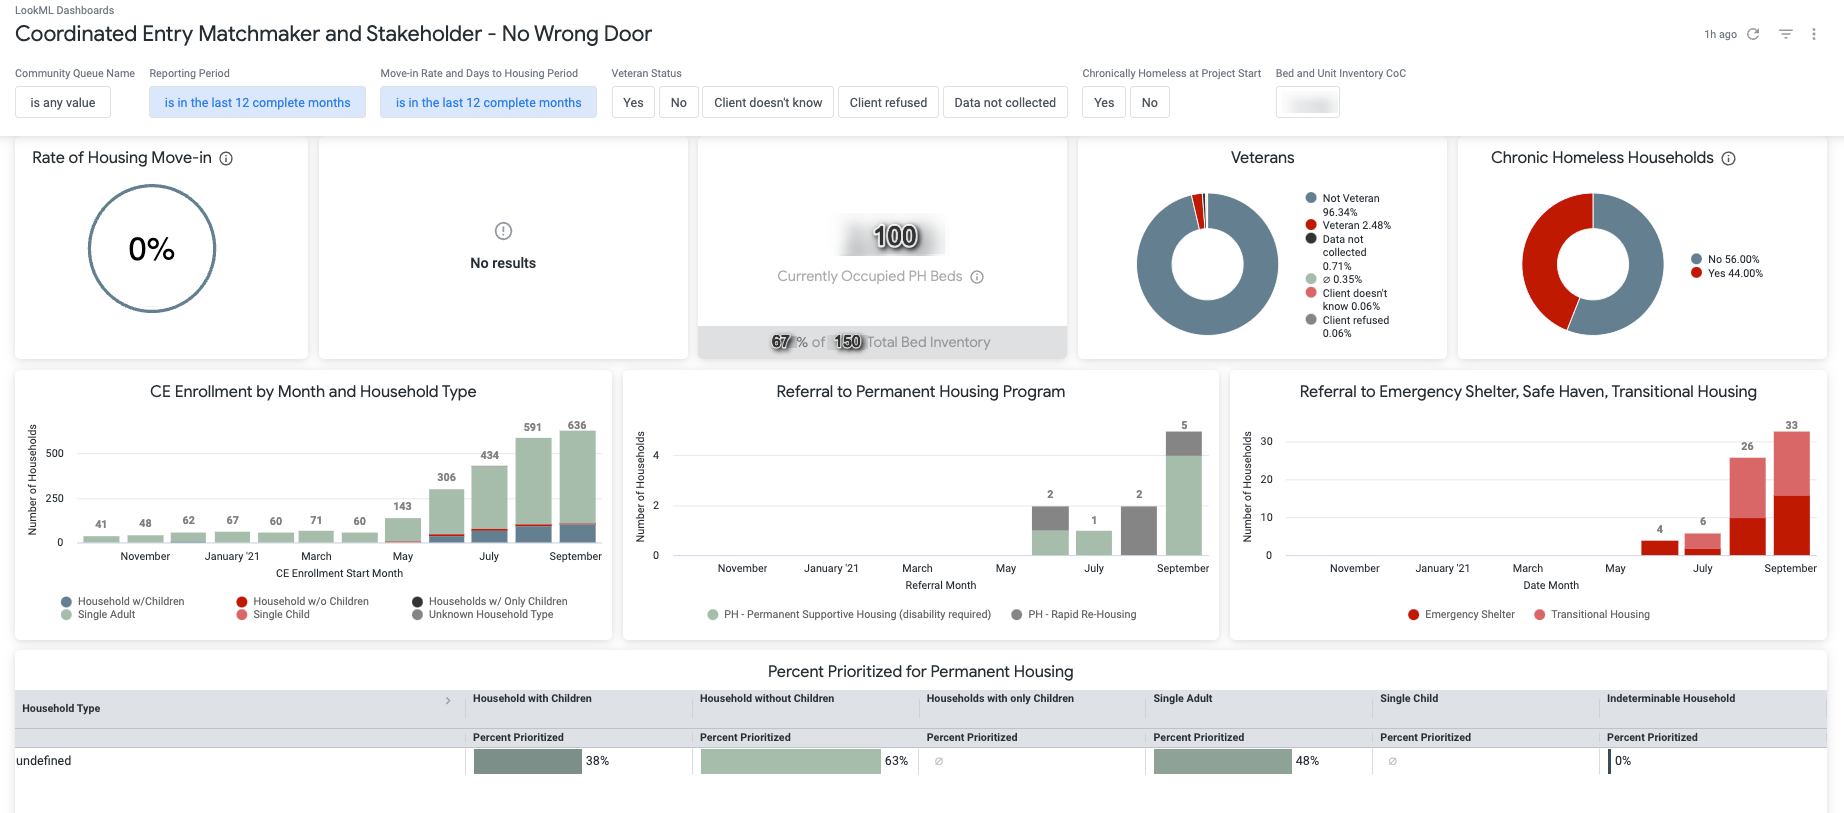
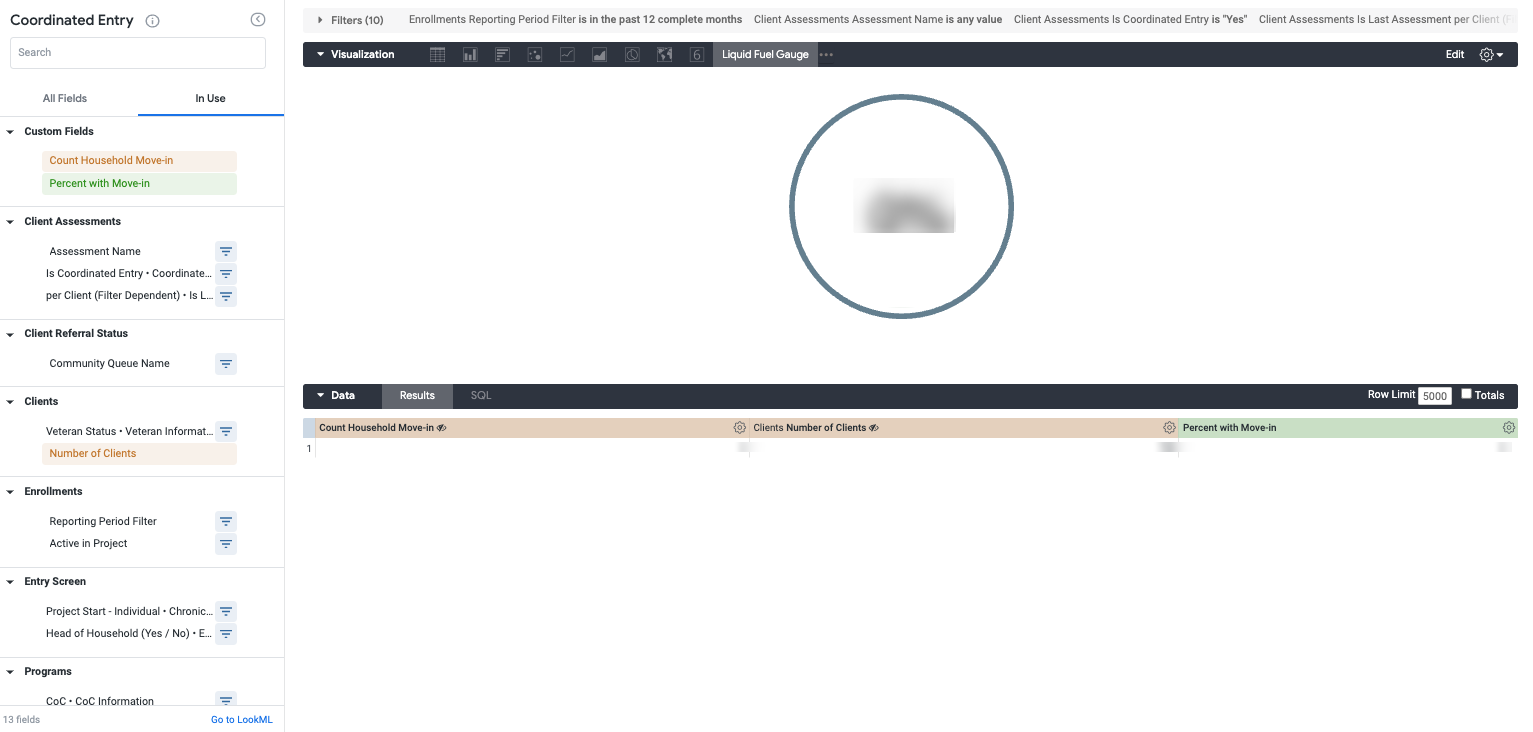
Rate of Move-in
This Look contains a liquid fuel gauge with the rate of successful move-in for households within the reporting period.
- Measures
- Count Households
- Count Household Move-in
- Table Calculation
- Percent with Move-in
- Explore the Look
- For more information on these clients, select either household count column for a detailed list. The drilldown contains ID, Household ID, Personal ID, Unique ID, Client Full Name, Project Start Date and Project Exit Date.
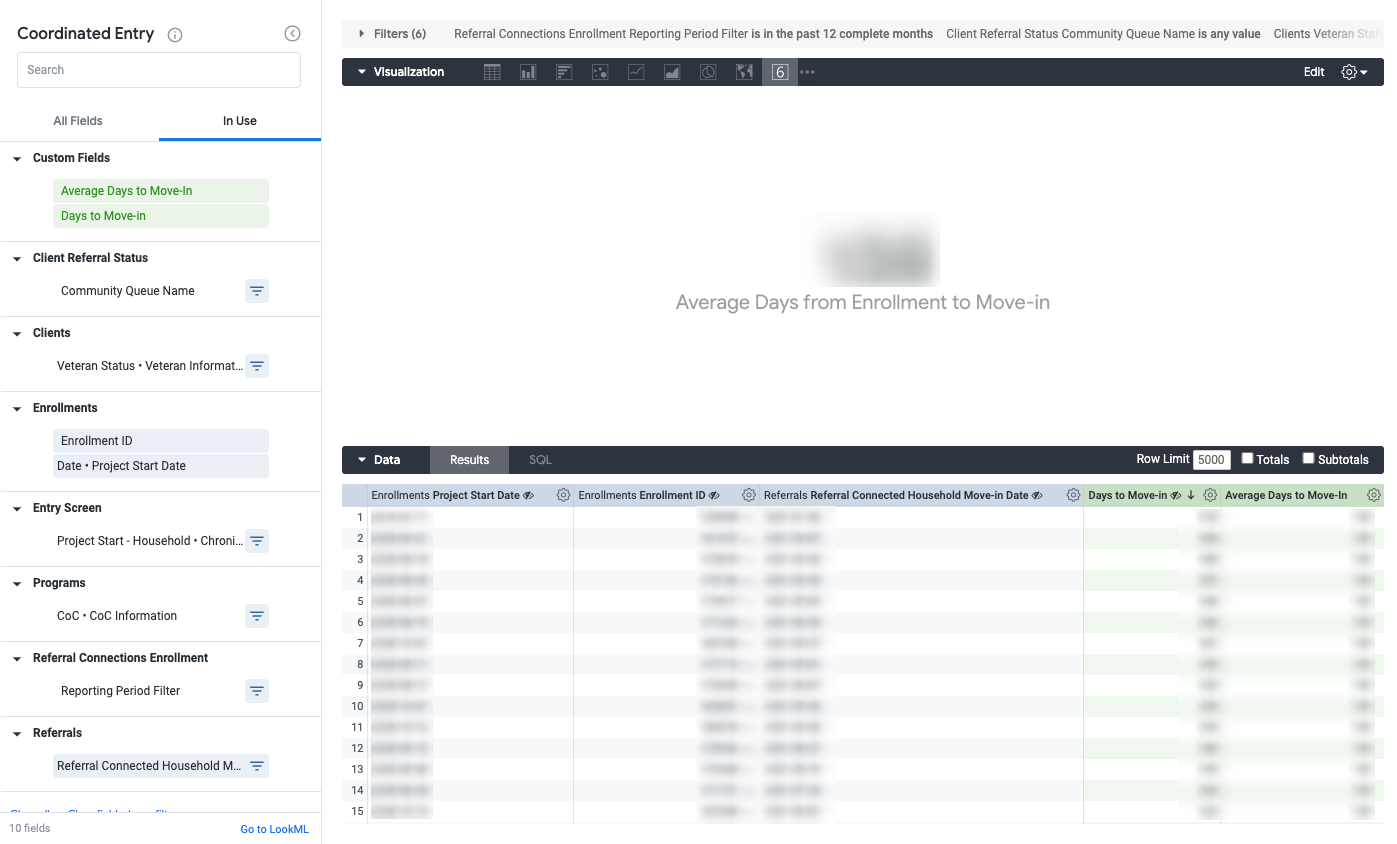
Average Days from CE Enrollment to Move-in
This Look contains the average days from enrollment project start date to household move-in date for all housed CE clients within the reporting period.
- Dimensions
- Enrollment ID
- Project Start Date
- Referral Connected Household Move-in Date
- Table Calculations
- Days to Move-in
- Average Days to Move-in
- Explore the Look
-
- For more information on the average days to move-in, exploring the look leads to a table with enrollment project start date, referral connected household move-in date, days to move-in and average days to move-in by enrollment ID.
- There are no drills available for this Look.
- For further analysis, sort the days to move-in column and review outliers.
-
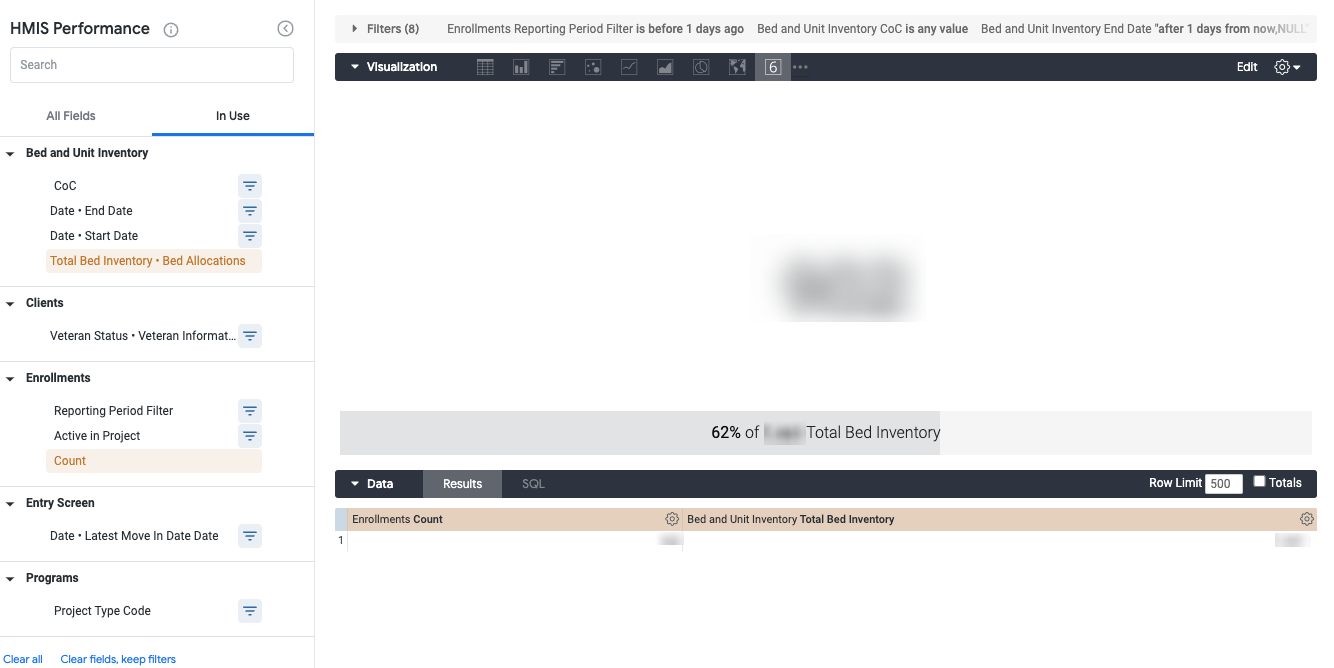
Occupied PH Beds
This Look contains an overview of current utilization with a count of currently occupied PH beds and a rate of utilization of the total PH bed inventory within the reporting period. Occupied PH beds is the one Look in this dashboard that uses the HMIS Performance model.
PH bed types included in this look are PH - Housing with Services (no disability required), PH - Permanent Supportive Housing (disability required) and PH - Housing Only.
- Measures
- Total Bed Inventory - Bed Allocations
- Enrollments - Count
- Explore the Look
- When exploring the Look, you will see that the visualization is set to calculate progress with a percentage which creates the bar underneath the count of occupied PH beds.
- For more information on the clients pulled into this data set, select the counts within the Enrollments Count or Bed and Unit Inventory - Total Bed Inventory columns. The drilldown contains Personal ID, Enrollment ID, Head of Household (Yes/No), Program Name, Project Start Date, Project Exit Date and Housing Move-in Date.
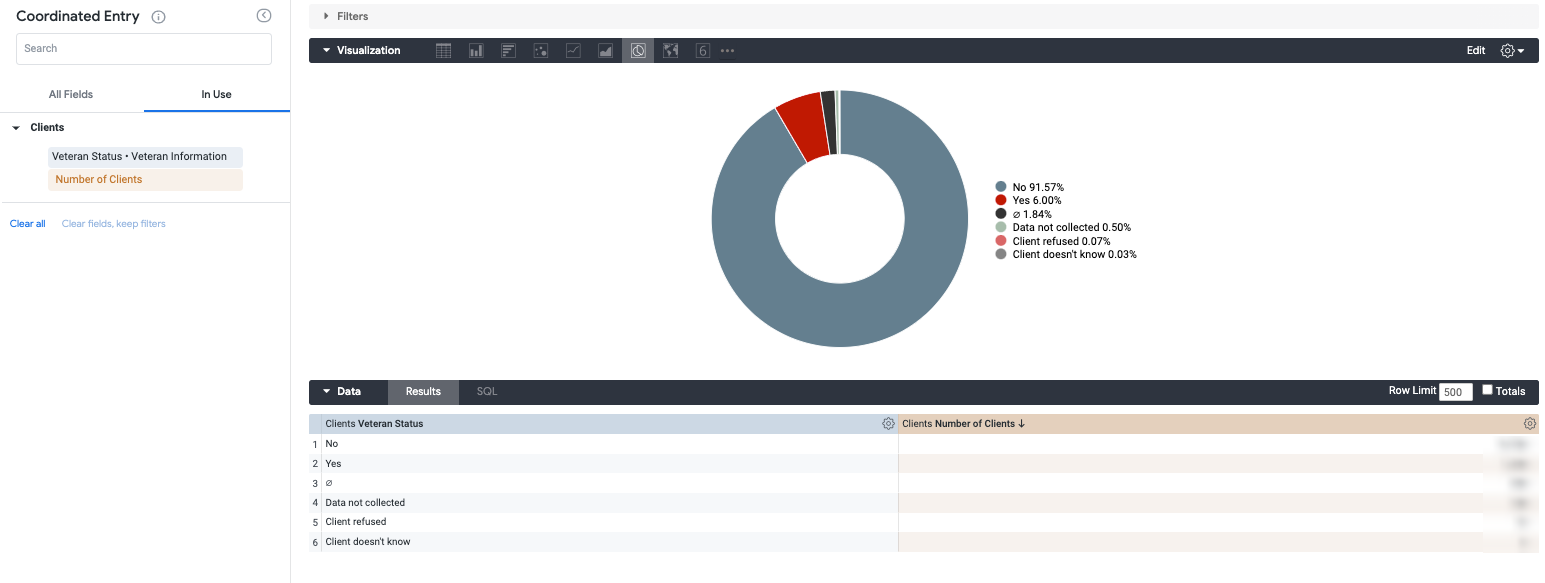
Veterans
This Look contains a breakdown of client veteran status for clients in the CE system within the reporting period.
- Dimensions
- Veteran Status
- Measures
- Number of Clients
- Explore the Look
- For more information on these clients, select the counts within the Number of Clients column for a detailed list. The drilldown contains ID, Household ID, Personal ID, Unique ID, Client Full Name, Project Start Date and Project Exit Date.
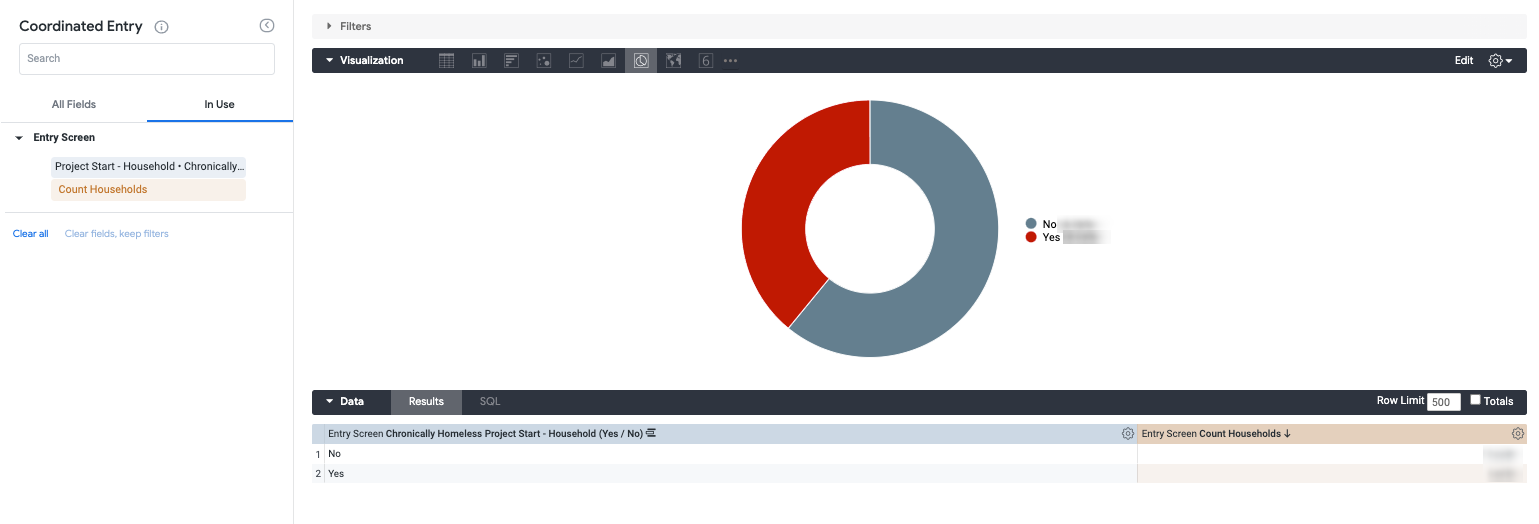
Chronic Homeless Households
This Look contains a yes/no count of households that were Chronically Homeless at project start within the reporting period.
- Dimensions
- Chronically Homeless Project Start - Household
- Measures
- Count Households
- Explore the Look
- For more information on these clients, select the counts within the Count Households column for a detailed list. The drilldown features ID, Household ID, Personal ID, Unique ID, Client Full Name, Project Start Date and Project Exit Date.
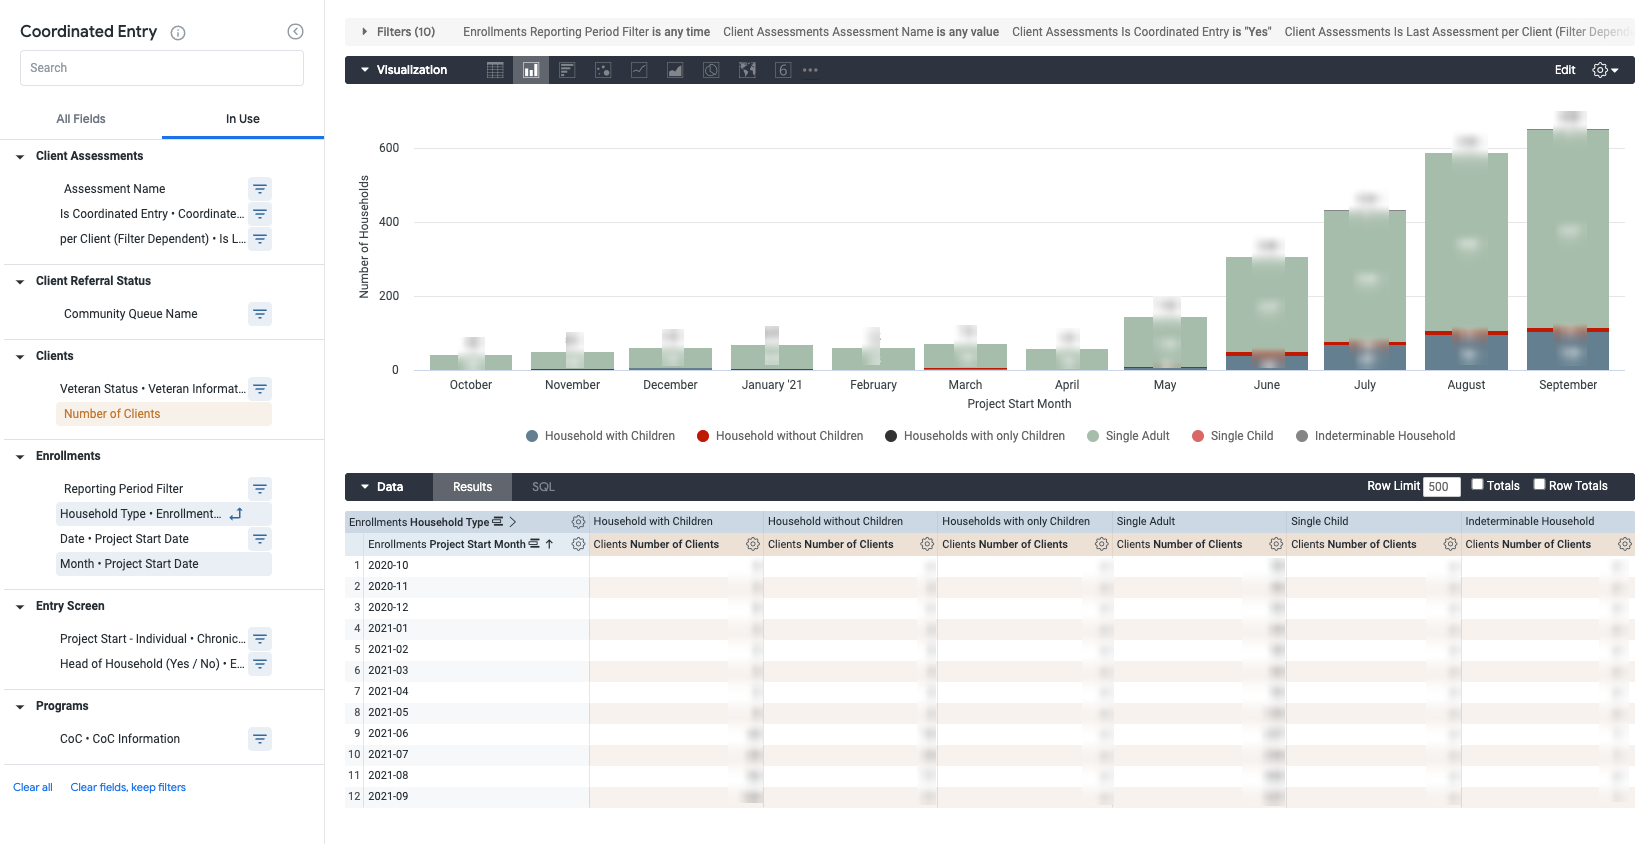
CE Enrollment by Month and Household Type
This Look contains an overview of monthly enrollment counts by household type within the reporting period.
- Dimensions
- Project Start Month
- Household Type
- Measures
- Number of Clients
- Filtered to only show Head of Households
- Number of Clients
- Explore the Look
- For more information on these client counts, select the counts within any of the Number of Clients columns for a detailed list of heads of households. The drilldown features Personal ID, Unique Identifier, Client Full Name, and Current Age.
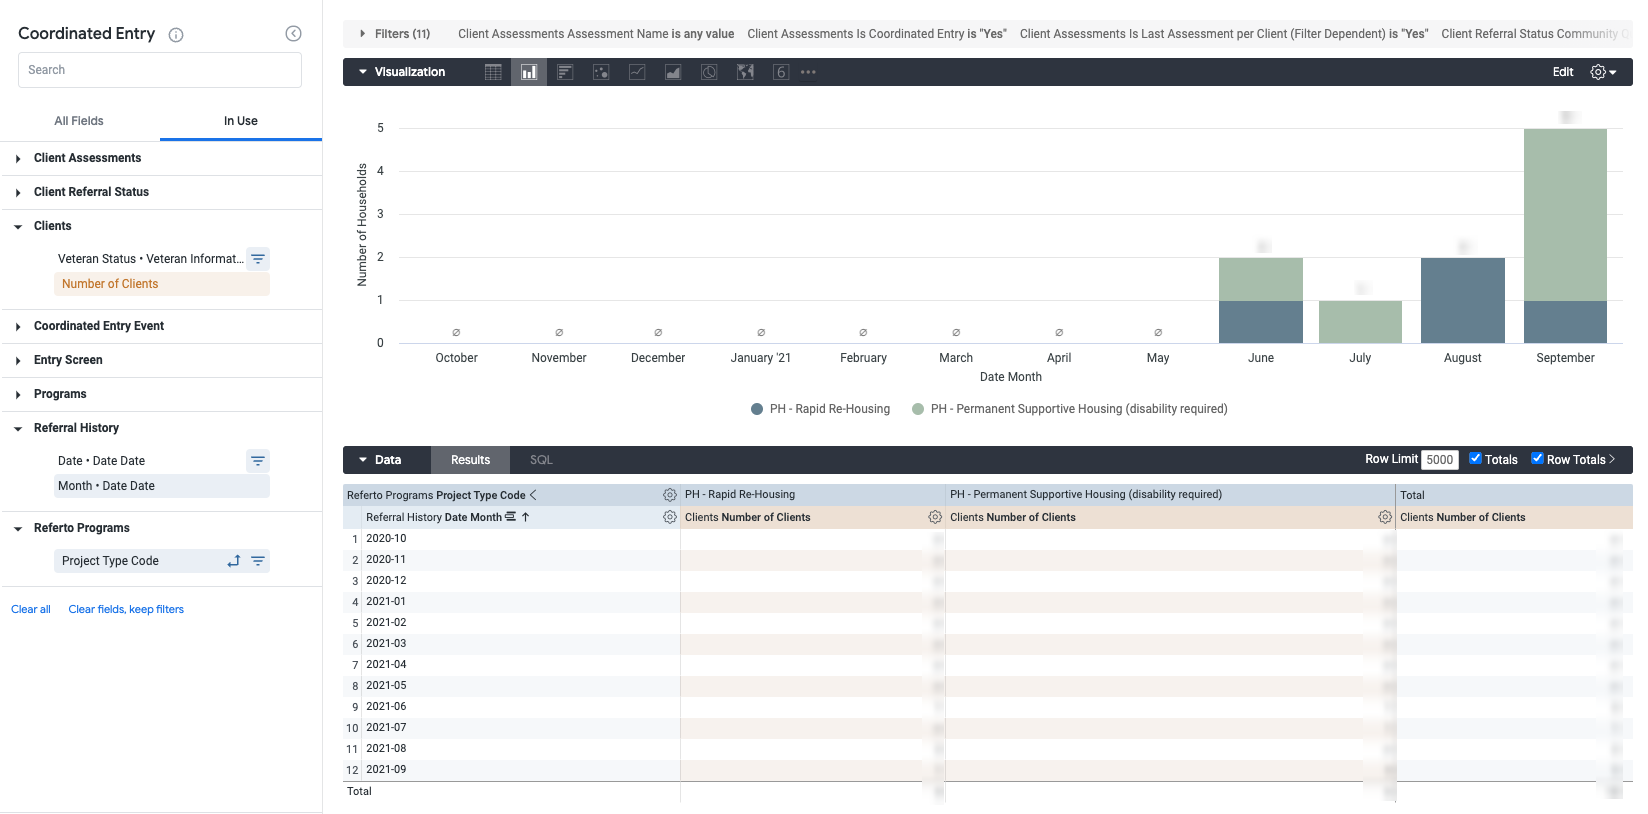
Referral to Permanent Housing Program
This Look contains an overview of monthly referral counts for Permanent Supportive Housing and Rapid Re-Housing within the reporting period.
- Dimensions
- Referral History Date Month
- Project Type
- Measures
- Number of Clients
- Explore the Look
- For more information on these clients, select the counts within any column for a detailed list. The drilldown contains Personal ID, Unique ID, Client Full Name, and Current Age.
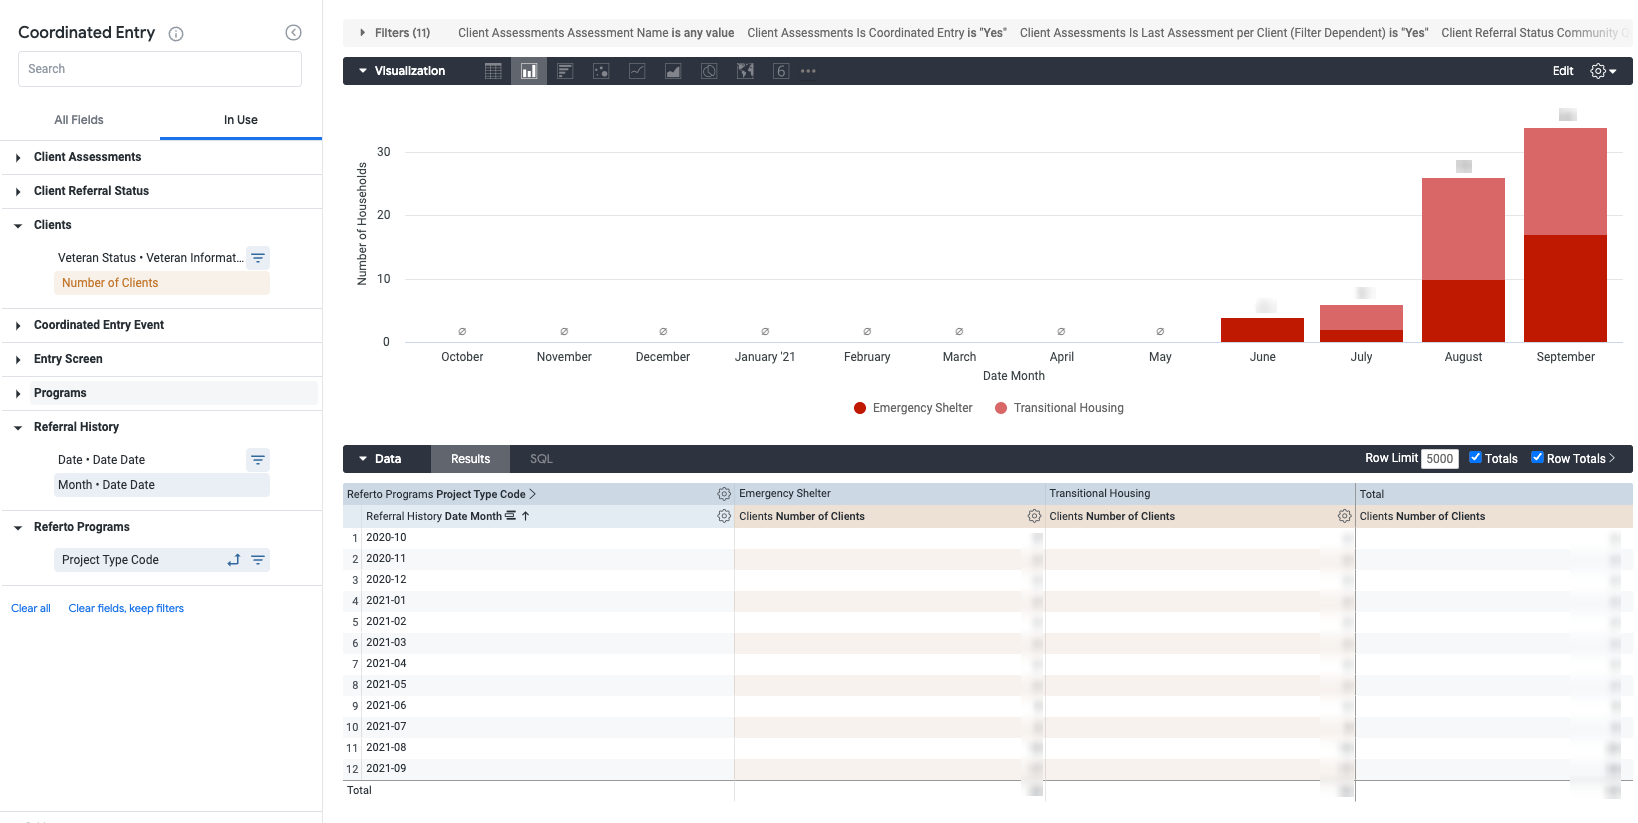
Referral to Emergency Shelter, Safe Haven or Transitional Housing
This Look contains an overview of monthly referral counts to Emergency Shelter, Safe Haven, or Transitional Housing within the reporting period.
- Dimensions
- Referral History Date Month
- Project Type
- Measures
- Number of Clients
- Explore the Look
- For more information on these clients, select the counts within any column for a detailed list. The drilldown contains Personal ID, Unique ID, Client Full Name, and Current Age.
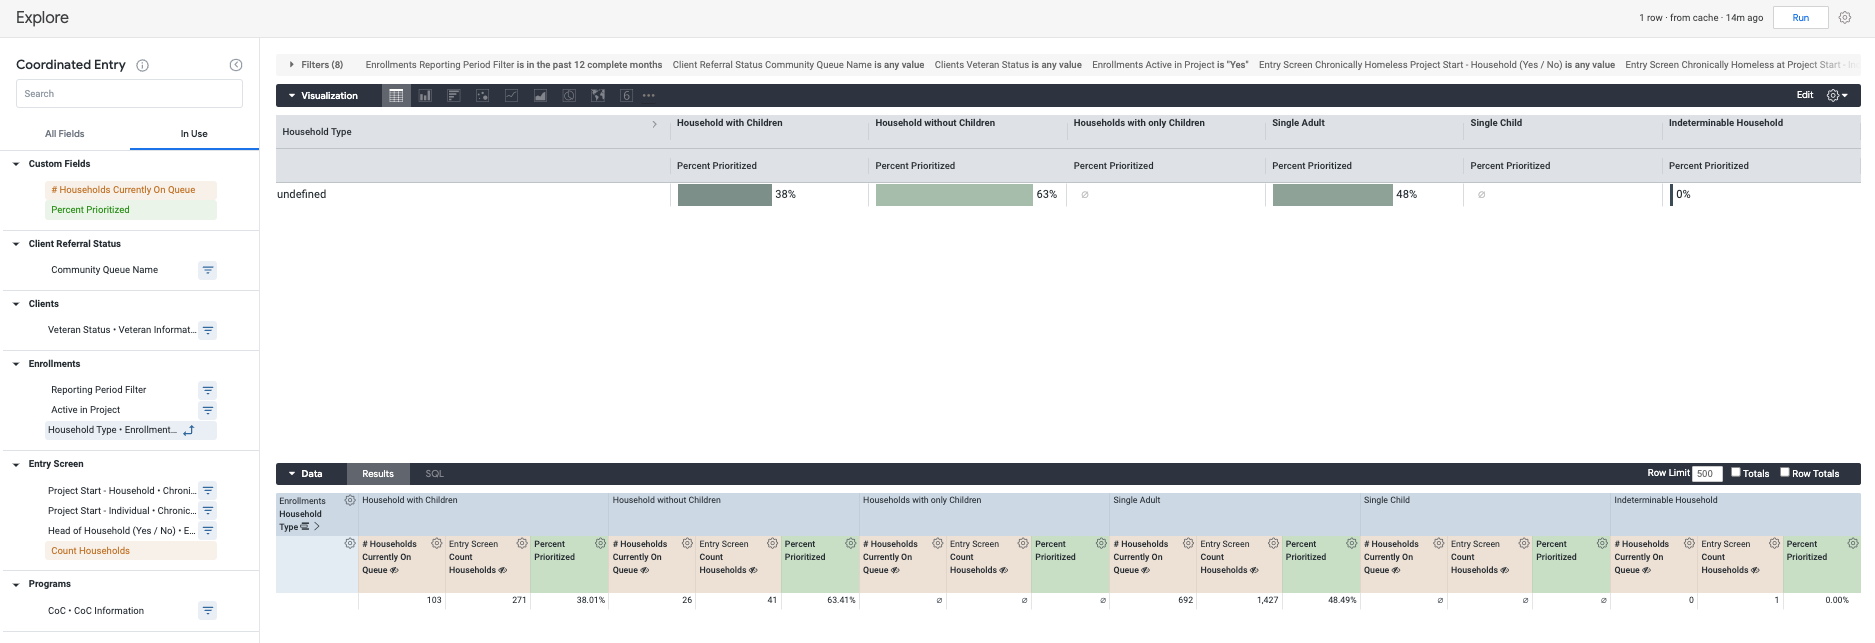
Percent Prioritized for Permanent Housing
This Look contains counts of household types and their associated rate of prioritization for Permanent Housing within the reporting period.
- Dimensions
- Household Type
- Enrollment Type
- Measures
- Count Households
- Custom Fields
- Custom Measure
- # Households Currently on Queue
- Custom Table Calculation
- Percent Prioritized
- Custom Measure
- Explore the Look
- For more information on these clients, select the counts within the # Household Currently on Queue or Count Households column for a detailed list. The drilldown contains ID, Household ID, Personal ID, Unique ID, Client Full Name, Project Start Date and Project Exit Date.
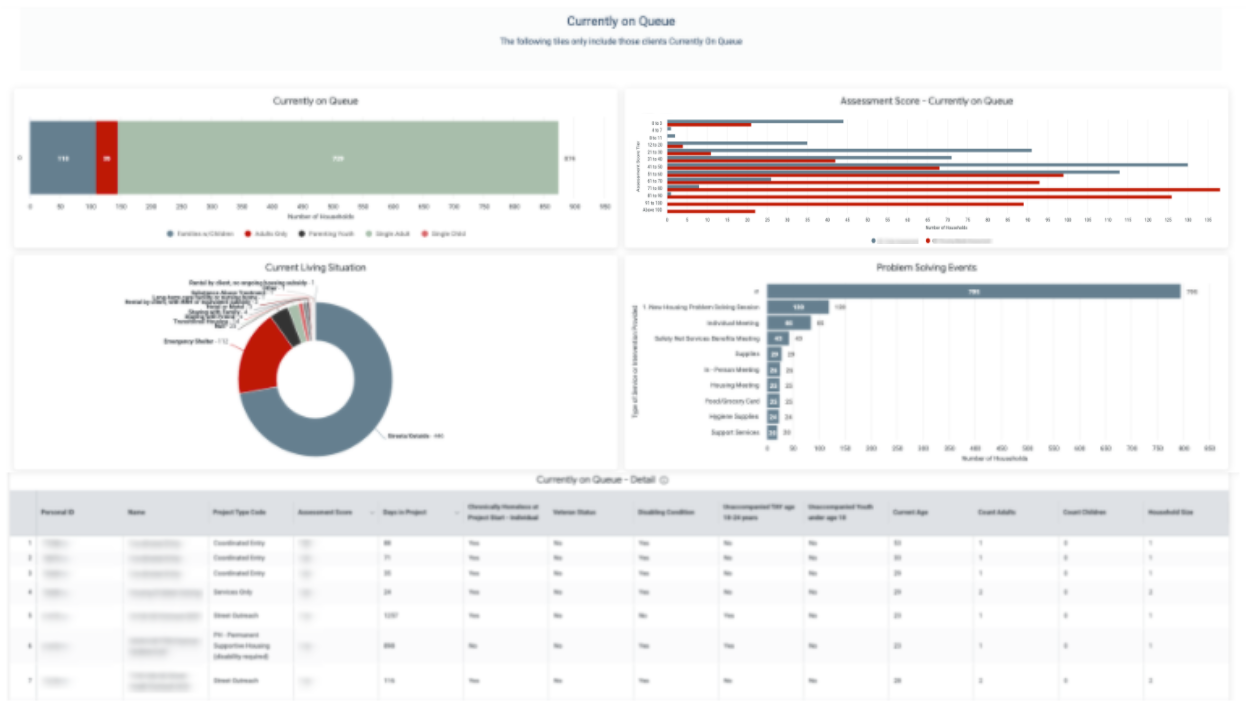
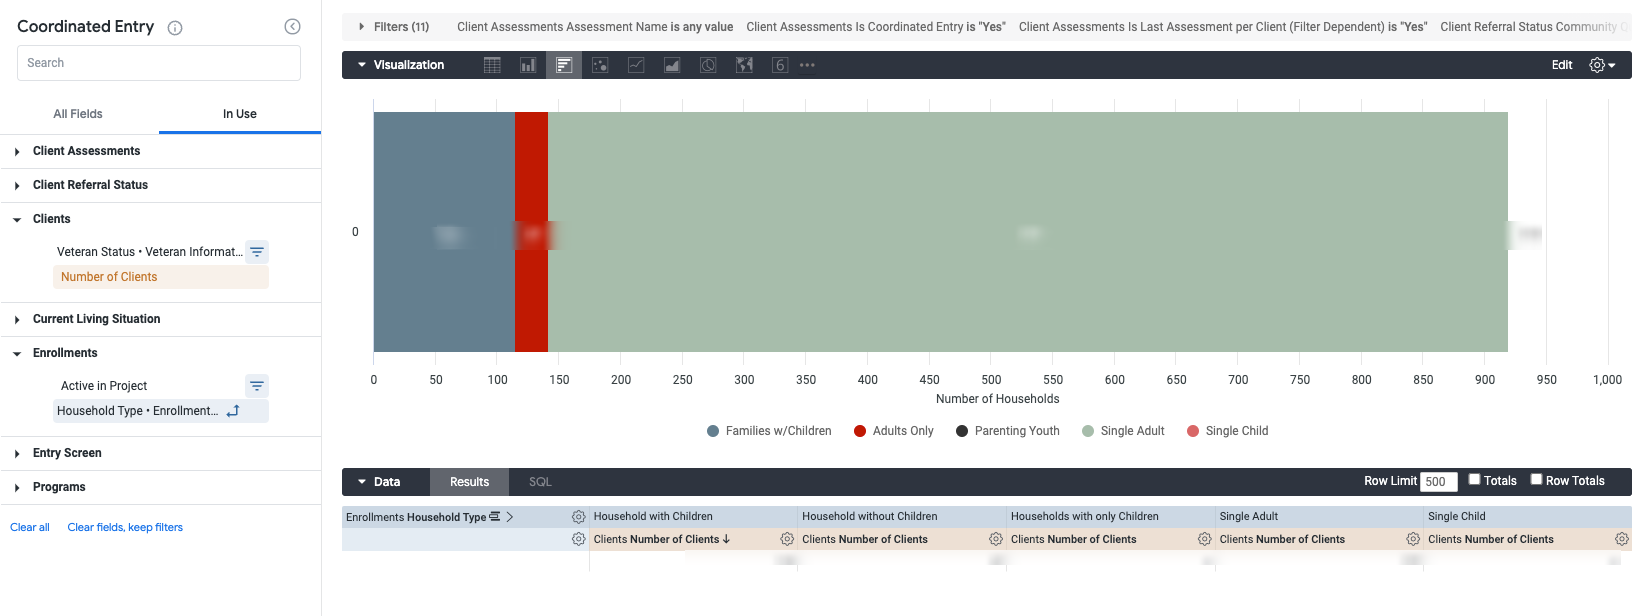
Currently on Queue
This Look contains an overall count of those on the Community Queue with a breakdown by household type.
- Dimensions
- Household Type
- Measures
- Number of Clients
- Explore the Look
- For more information on these household counts, select the counts within any of the Number of Clients columns for a detailed list of heads of households. The drilldown features Personal ID, Unique Identifier, Client Full Name, and Current Age.
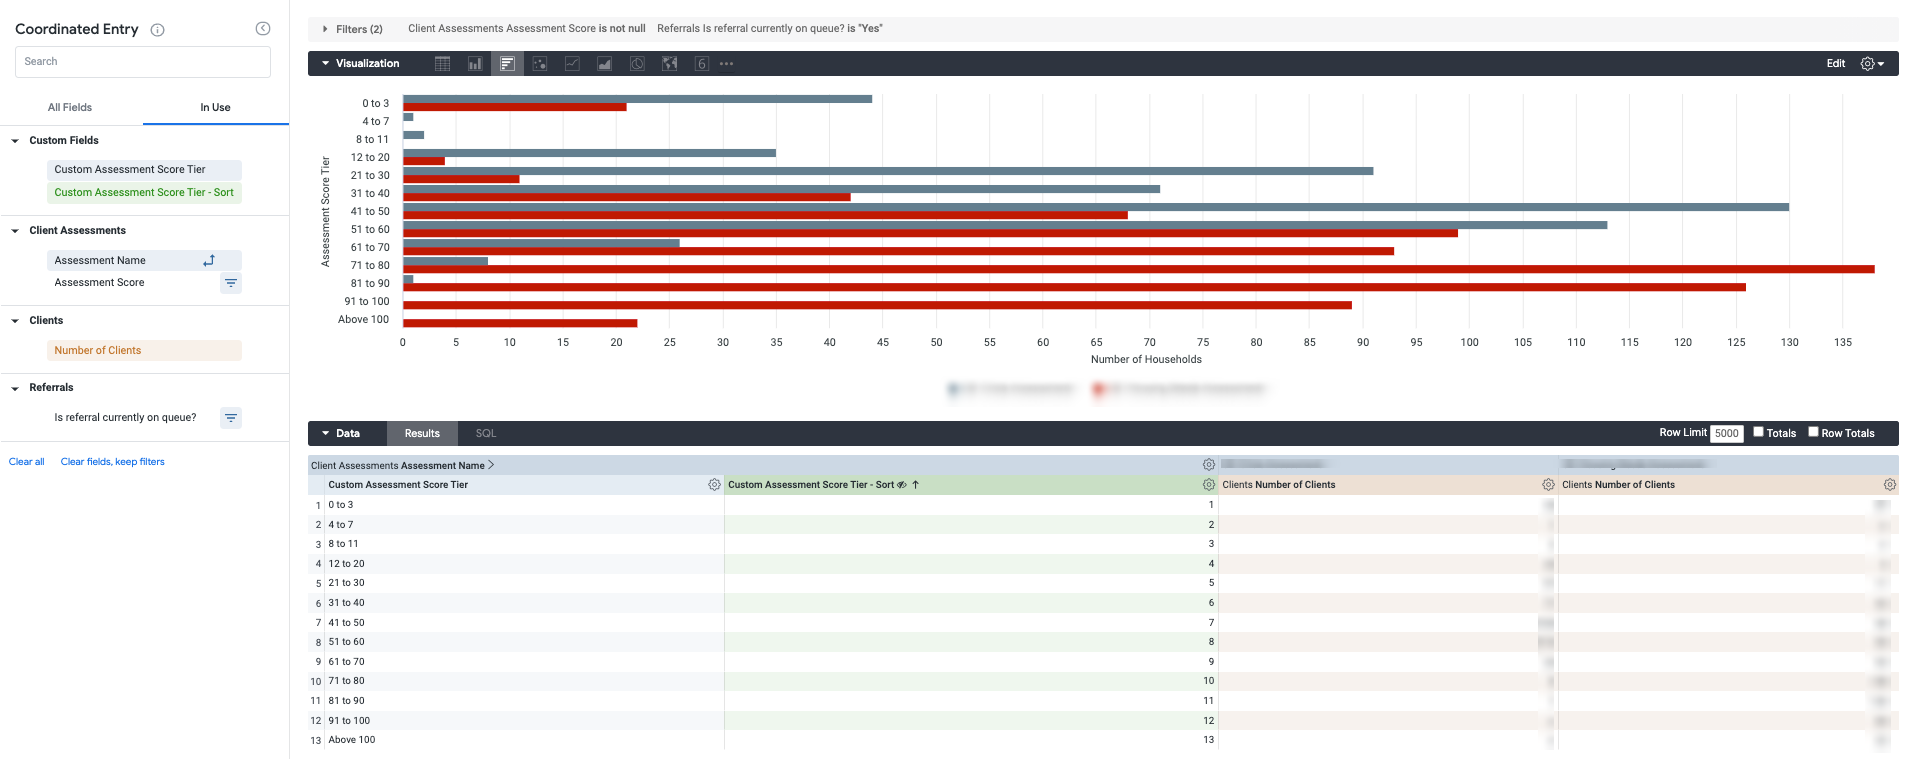
Assessment Score - Currently on Queue
This Look contains an overview of counts of all assessment scores currently on the Community Queue within the Coordinated Entry model.
Note: Each community’s Look may look slightly different based upon the assessments used in your community and their scoring ranges.
- Dimensions
- Assessment Score
- Assessment Name
- Measures
- Number of Households
- Explore the Look
- For more information on these household counts, select the counts within any of the Number of Clients columns for a detailed list of heads of households.The drilldown features Personal ID, Unique Identifier, Client Full Name, and Current Age.
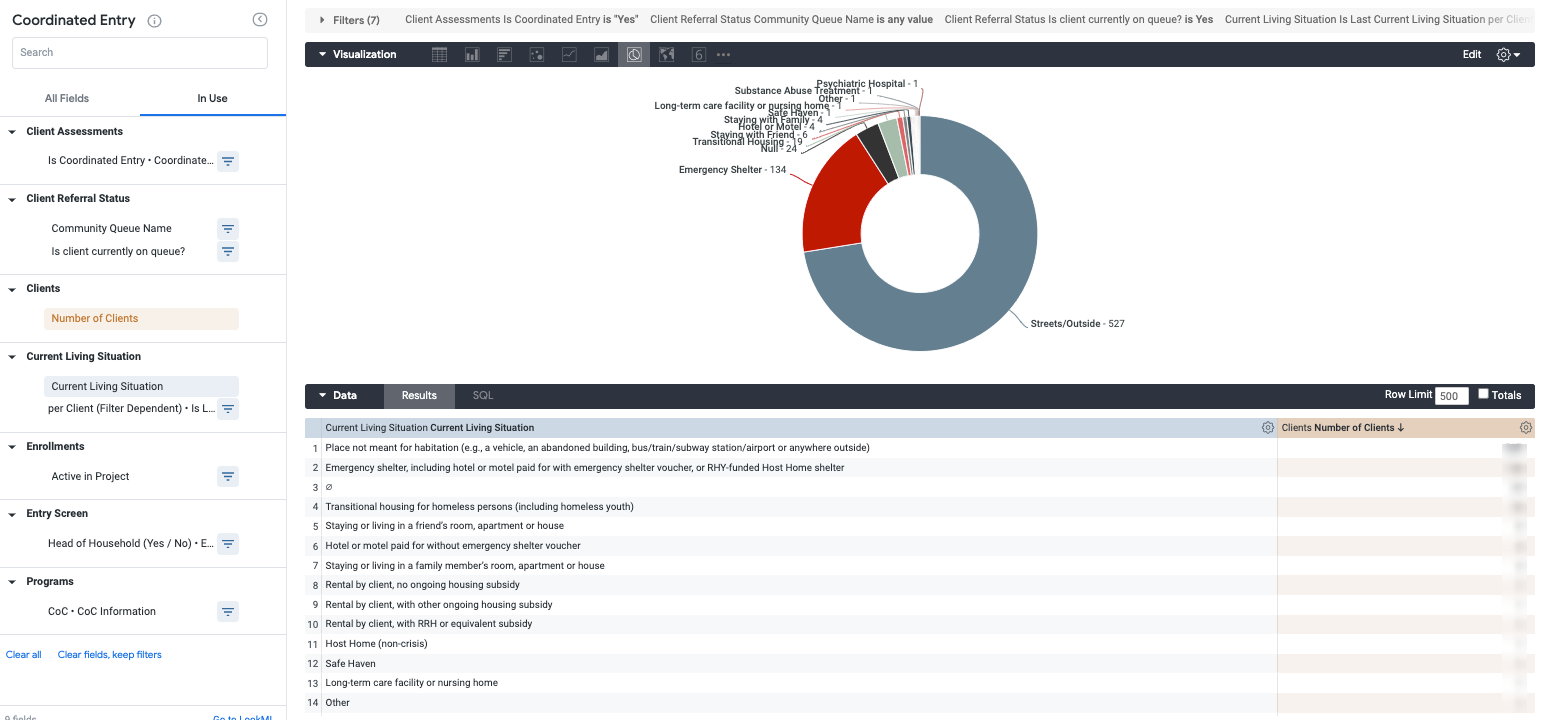
Current Living Situation
This Look contains counts of active clients and their last Current Living Situation within the reporting period.
- Dimensions
- Current Living Situation
- Measures
- Number of Clients
- Explore the Look
- For more information on these clients, select the counts within the #Number of Clients column for a detailed list. The drilldown contains Personal ID, Unique ID, Client Full Name, and Current Age.
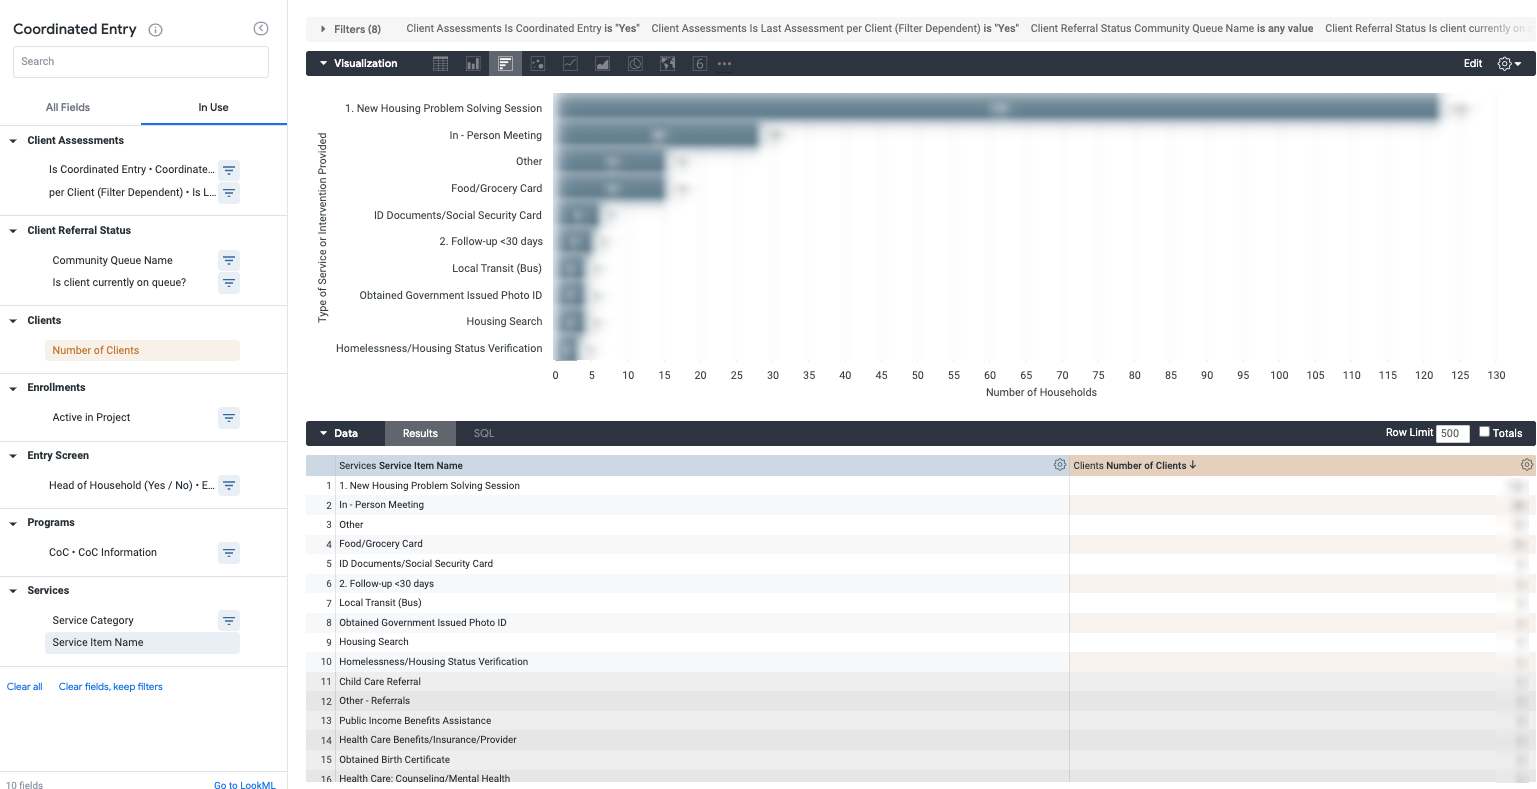
Problem Solving Event
This Look contains an overview of problem solving event services and the count of active clients that have received each type within the reporting period.
- Dimensions
- Service Item Name
- Measures
- Number of Clients
- Explore the Look
- The visualization highlights the top 10 utilized Coordinated Entry Event services, select “Explore from here” for a table with the additional Service Items.
- For more information on these clients, select the counts within the Number of Clients column for a detailed list. The drilldown contains Personal ID, Unique ID, Client Full Name, and Current Age.
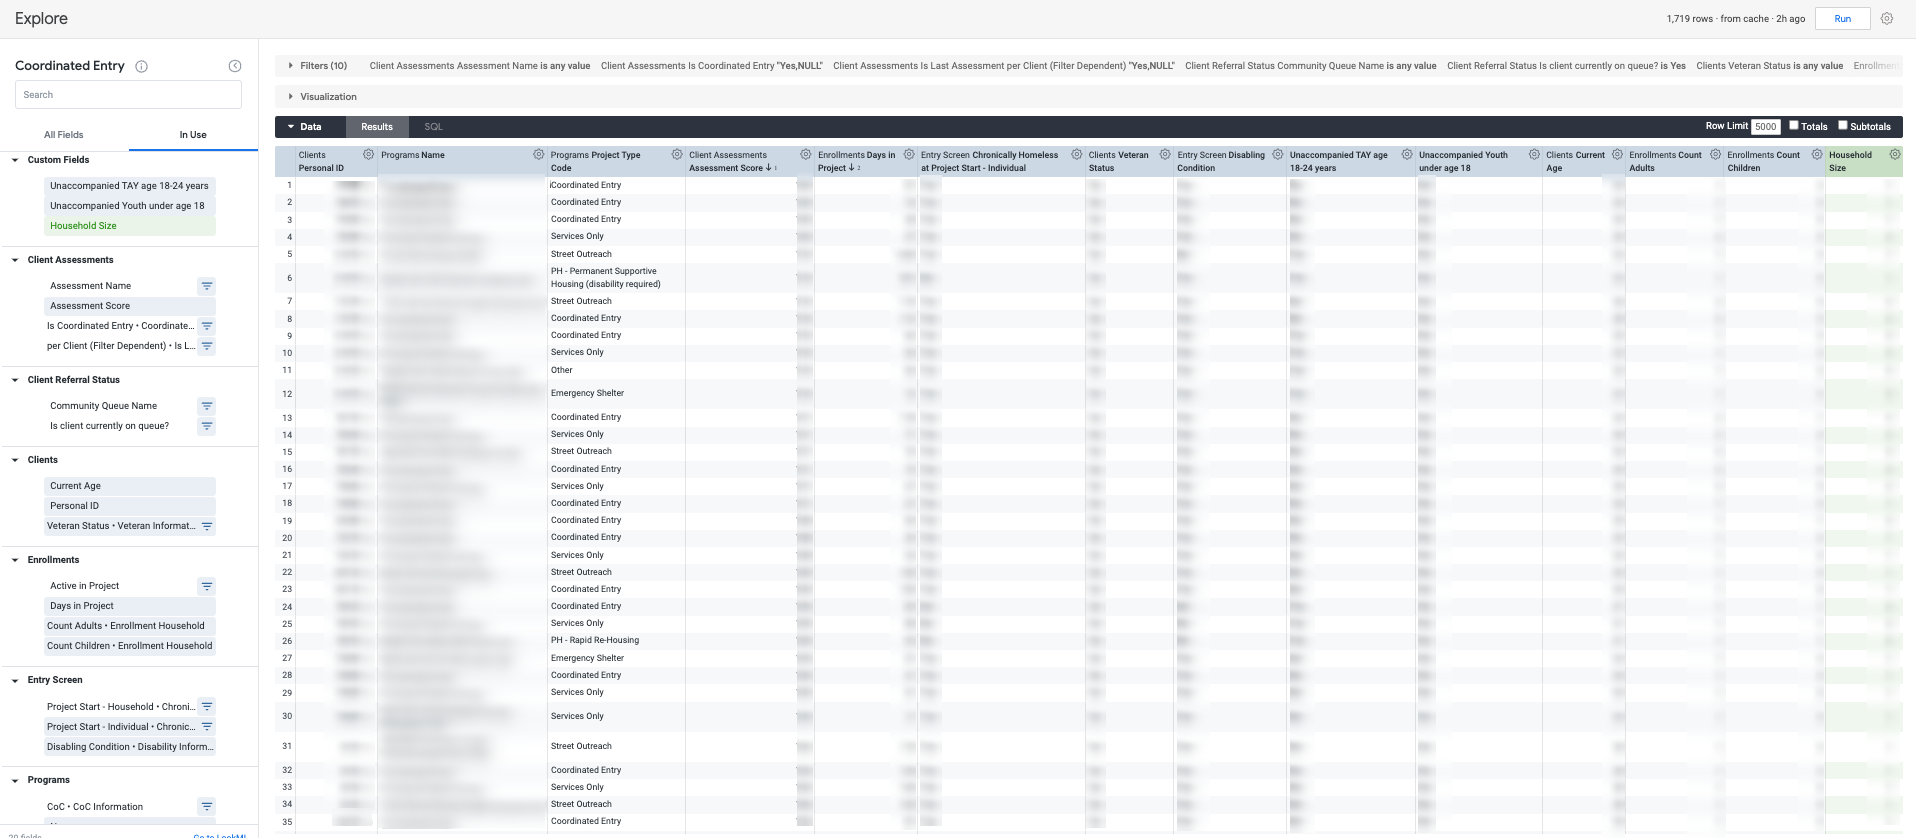
Currently on Queue - Detail
This Look contains a detailed list of clients currently on queue within the reporting period.
- Dimensions
- Client Assessments - Assessment Score
- Clients - Current Age
- Clients - Personal ID
- Clients - Veteran Status
- Enrollments - Days in Project
- Enrollments - Count Adults
- Enrollments - Count Children
- Entry Screen - Project Start - Individual - Chronically Homeless
- Entry Screen - Disabling Condition - Disability Information
- Programs - Name
- Programs - Project Type Code
- Custom Fields
- Custom Dimension
- Unaccompanied TAY Age 18-24 Years
- Unaccompanied Youth Under Age 18
- Table Calculation
- Household Size
- Custom Dimension
- Explore the Look
- The table shown on the dashboard is the same table in “Explore from here”.
- There are no drills available for this Look as all information is within the table.