Retiring Soon - Updated Clarity Usage and System Stats Dashboard Coming Soon
System Administrators may find this dashboard provides a quick snapshot of usage, data quality errors and other big picture statistics.
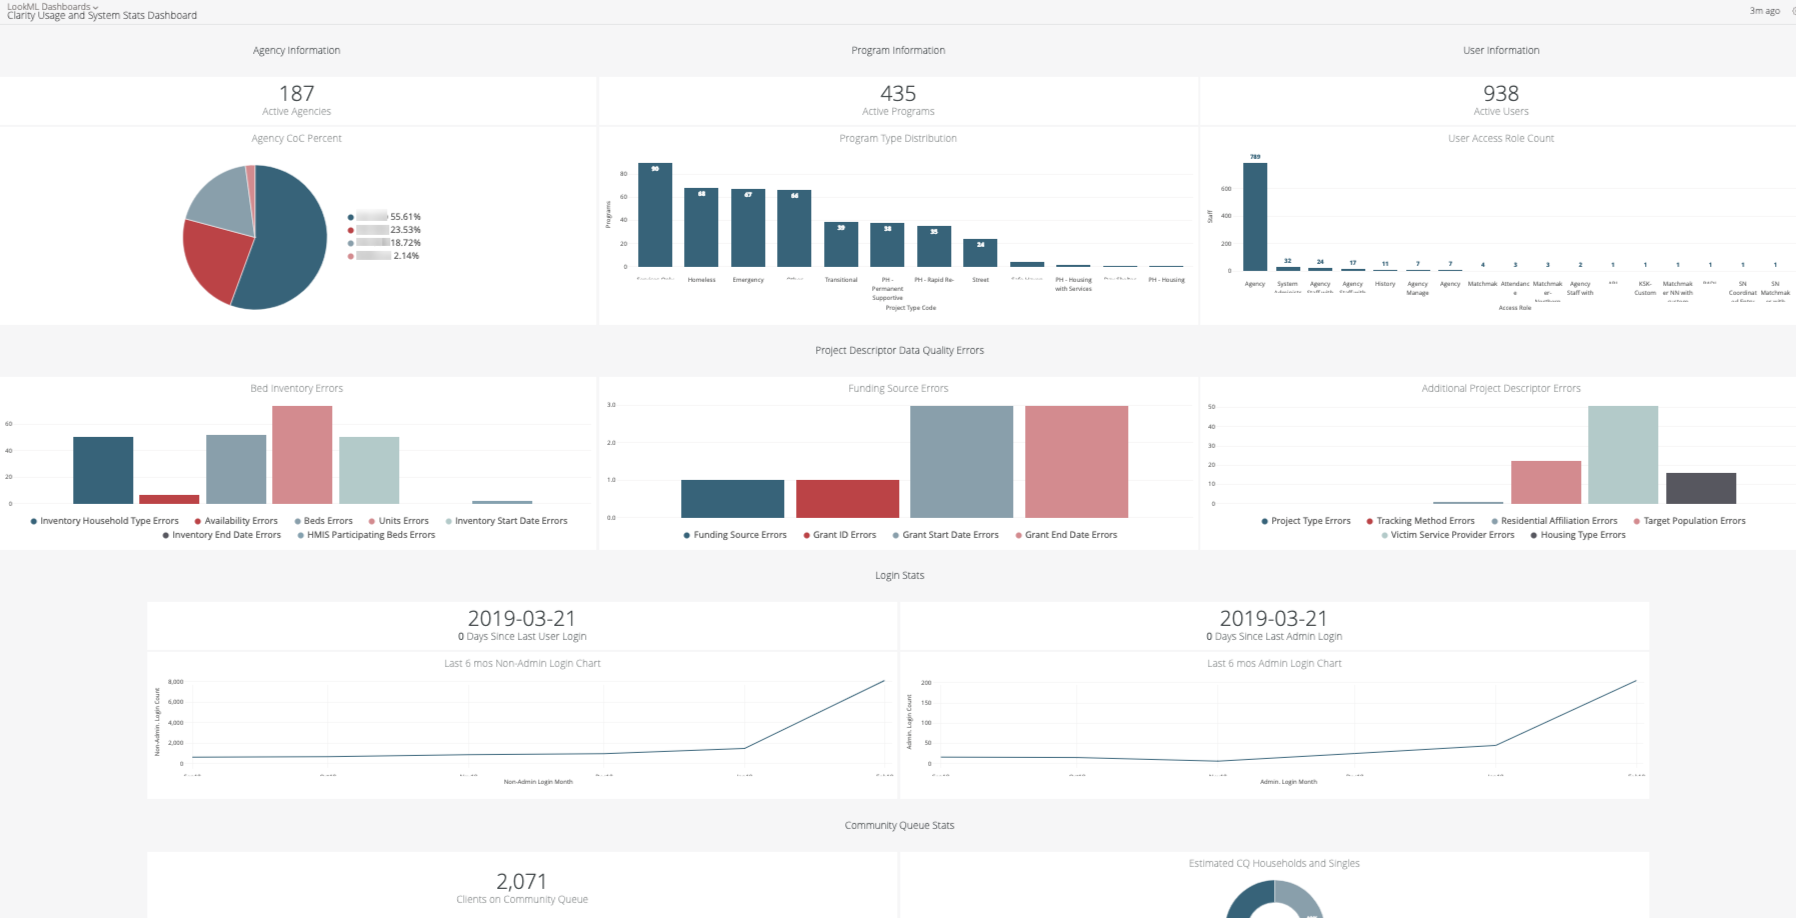
Tiles Overview
Active Agencies
- Project Descriptor Model
- Agencies, Count
- Filtered to: Agencies, Agency Active? Is Active
Agency CoC Percent
- Project Descriptor Model
- Agencies, CoC Code
- Agencies, Count
- Filtered to: Agencies, Agency Active? Is Active
Active Programs
- Project Descriptor Model
- Programs, Count
- Filtered to: Programs, Program Active is Active
Program Type Distribution
- Project Descriptor Model
- Programs, Project Type Code
- Programs, Count
- Filtered to: Programs, Program Active is Active
Active Users
- Project Descriptor Model
- Staff, Count
- Filtered to:
- Staff Deleted is No
- Staff Status is not "Inactive"
User Access Role Count
- Project Descriptor Model
- Staff, Access Role
- Staff, Count
- Filtered to:
- Staff Deleted is No
- Staff Status is not "Inactive"
- Staff User ID is not null
Bed Inventory Errors
- Data Quality Model
- DQ Project Descriptor
- Inventory Household Type Error Count
- Availability Error Count
- Beds Error Count
- Units Error Count
- Inventory Start Date Error Count
- Inventory End Date Error Count
- HMIS Participating Beds Error Count
- Filtered to:
- Enrollments, Reporting Period Filter is any time
- Program Inventory, Deleted is No
- Programs, Program Active is Active
Funding Source Errors
- Data Quality Model
- DQ Project Descriptor
- Funding Source Error Count
- Grant ID Error Count
- Grant Start Date Error Count
- Grant End Date Error Count
- Filtered to:
- Enrollments, Reporting Period Filter is any time
- Programs, Program Active
Additional Project Descriptor Errors
- Data Quality Model
- DQ Project Descriptor
- Project Type Error Count
- Tracking Method Error Count
- Residential Affiliation Error Count
- Target Population Error Count
- Victim Service Provider Error Count
- Housing Type Error Count
- Filtered to:
- Enrollments, Reporting Period Filter is any time
- Programs, Program Active is Active
Days Since Last User Login
- Project Descriptor Model
- Staff, Last Visited Date
- Table Calculation of Days Since Last User Login:
- diff_days(${members.last_visited_date},now())
- Filtered to" Staff Access Role is not "System Administrator" or "API"
Last 6 mos Non-Admin Login Chart
- Project Descriptor Model
- Staff Activity Logs, Date in Month
- Staff Activity Logs, Count
- Filtered to:
- Staff, Access Role is not "System Administrator" or "API"
- Staff Activity Logs, Date in Month is in the past 6 complete months
Days Since Last Admin Login
- Project Descriptor Model
- Staff, Last Visited Date
- Table Calculation of Days Since Last User Login:
- diff_days(${members.last_visited_date},now())
- Filtered to" Staff Access Role is "System Administrator"
Last 6 mos Admin Login Chart
- Project Descriptor Model
- Staff Activity Logs, Date in Month
- Staff Activity Logs, Count
- Filtered to:
- Staff, Access Role is "System Administrator"
- Staff Activity Logs, Date in Month is in the past 6 complete months
Clients on Community Queue
- Coordinated Entry Model
- Clients, Number of Clients
- Filtered to Client Referral Status Currently on Queue is Yes
Families on Community Queue
- Coordinated Entry Model
- Clients, Number of Global Household IDs
- Filtered to Client Referral Status Currently on Queue is Yes
Estimated CQ Household and Singles
- Coordinated Entry Model
- Number of Global Household IDs
- Table calculation of Singles:
- [Number of Clients] - [Number of Global Household IDs]
- Filtered to: Client Referral Status Currently on Queue is Yes
- Donut Multiples Visualization